
The just-released 2022 Q3 Houzz Renovation Barometer provides timely insights into the impact of recent economic volatility on the home renovation market. While the majority of businesses across both the construction and the architectural and interior design sectors reported more increases than decreases in recent business activity, expectations for continued demand are tempered as homeowners await signs of national economic stability.
“Following the strong residential remodeling and design activity of the past two years, it’s unsurprising that businesses are leveling their expectations as current economic conditions now impact both sides of the industry,” Houzz staff economist Marine Sargsyan says. “Rising interest rates and inflation have put downward pressure on homeowners’ demand for professional services in the short term, giving pros an opportunity to clear up lengthy backlogs. That said, homeowners managing the demands of aging housing stock and housing market shortages will continue to drive home renovation and design activity in the long run.”
Project Wait Times Return to 2021 Levels Across Home Renovation Industry
The 2022 Q3 Houzz Renovation Barometer looks at second-quarter residential renovation market expectations, project backlogs and recent business activity among construction, architectural and design firms, based on responses from 1,151 small businesses on Houzz. The survey was fielded June 30, 2022, through July 11, 2022.
The latest Backlog Indicator finds an average wait time of 10.5 weeks to start a new midsize project for the construction sector, a return to similar wait times from a year ago. This is a significant change from the 2022 Q2 Houzz Renovation Barometer, which recorded the longest project wait time for construction pros (12 weeks) since the Backlog Indicator was added to the Barometer in 2017.
Project wait times are also easing for architects and interior designers. The average wait time to start a new midsize project in this sector has dropped three quarters in a row and now stands at 7.5 weeks.
Read on to find out more about what remodeling industry firms are saying about current business conditions. We’ll look first at construction companies and then at architectural and design firms. We’ll start with what these firms expect for the next three months, then look at their project wait times. Last, we’ll review their business activity over the previous three months.
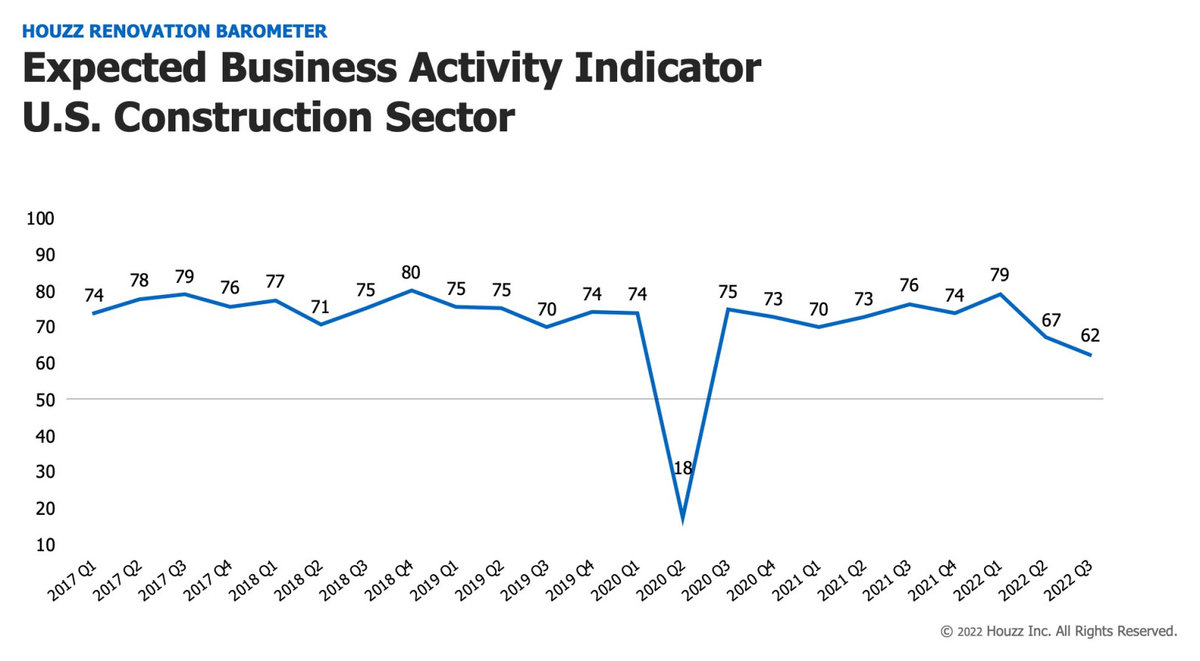
A score higher than 50 indicates that more firms reported increases in their business expectations than reported decreases.
Construction Firms
1. Expectations for business activity decreased.
The Expected Business Activity Indicator, related to project inquiries and new committed projects, decreased to 62 for the third quarter from 67 for the second quarter of 2022. The decline in expectations was significant for both project inquiries and new committed projects (with scores going from 65 to 62 and from 69 to 63, respectively).
Build-only remodelers reported a 4-point decline (from 73 to 69) in expectations for project inquiries and new committed projects for the third quarter of this year compared with the second quarter. Expectations for design-build remodelers also decreased significantly (from 62 for Q2 to 56 for Q3).
The Expected Business Activity Indicator for construction firms for Q3 dropped by 14 points year over year. This indicator is based on survey questions about whether businesses expect the number of project inquiries and new projects to increase, decrease or remain unchanged in the coming three months compared with the prior three months. A score higher than 50 indicates that more firms expect increases than decreases.

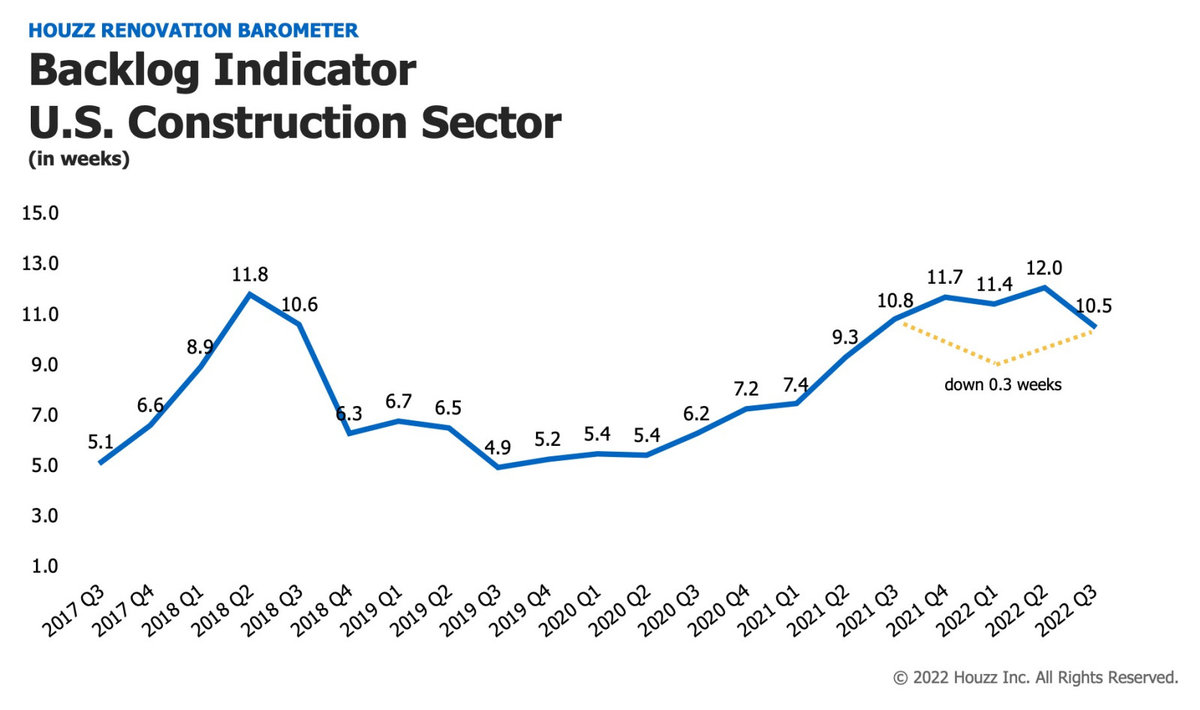
2. Project wait times are easing. Project backlogs are now shorter after reaching a record high at the start of the second quarter (the longest since the Backlog Indicator was added to the Barometer in 2017). The average wait time for new midsize projects to begin decreased from 12 weeks in the second quarter of 2022 to 10.5 weeks in the third quarter.
Build-only remodelers reported a wait time of 8.8 weeks to take on a new project, while the average wait among design-build firms was 12.3 weeks. Year over year, the wait times are shorter by nearly two weeks for build-only firms and a little over one week for design-build firms.
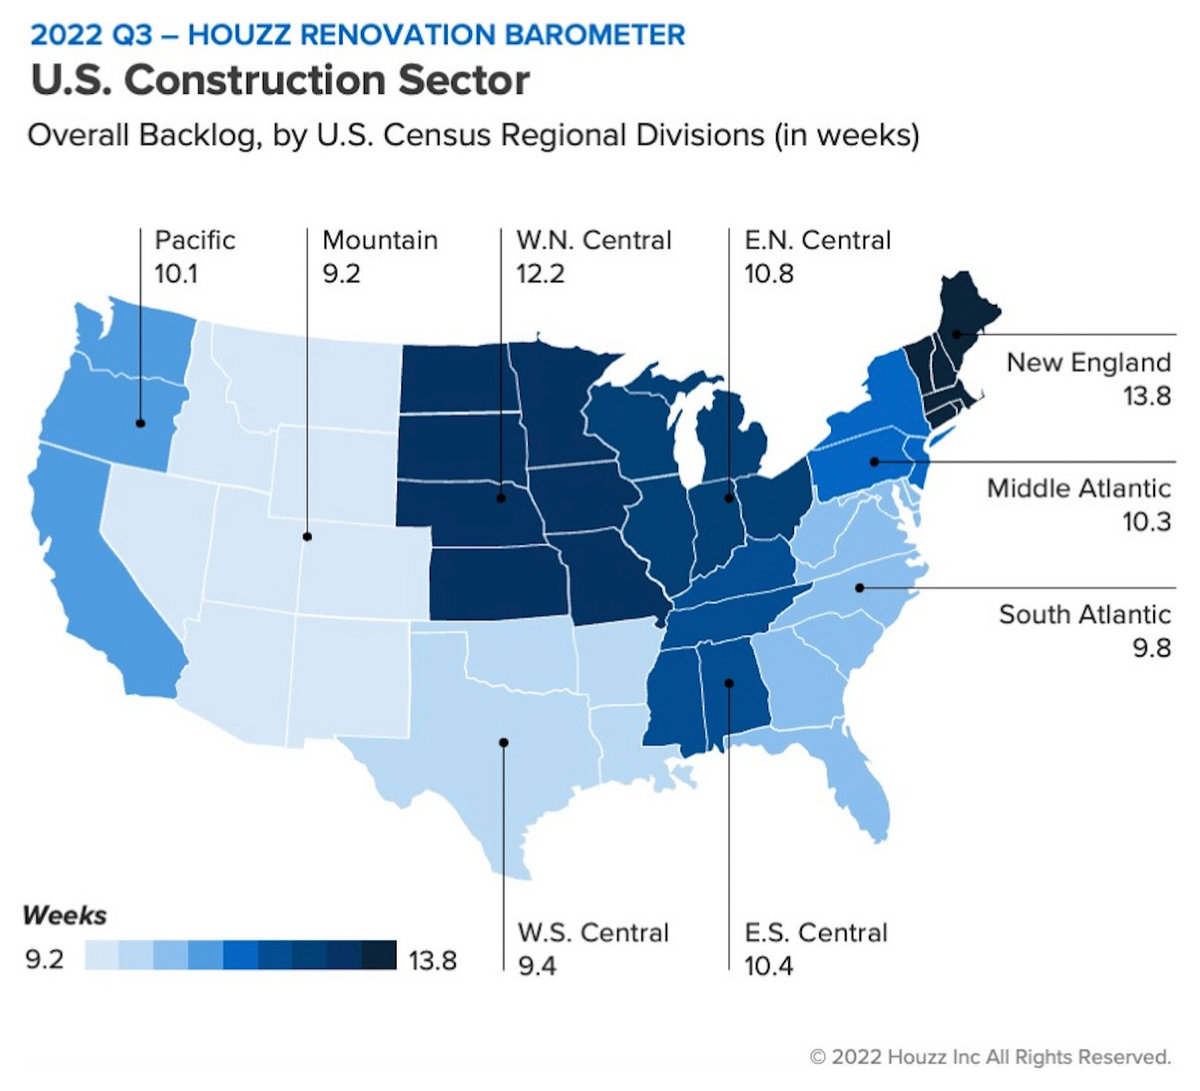
Backlogs differ quite a bit by region, as this map shows. The Mountain division of the U.S. (Arizona, Colorado, Idaho, Montana, New Mexico, Nevada, Utah, Wyoming) has the shortest average wait time (9.2 weeks), while the New England division (Connecticut, Maine, Massachusetts, New Hampshire, Rhode Island and Vermont) has the longest (13.8 weeks).
A score higher than 50 indicates that more firms reported increases in their recent business activity than reported decreases.
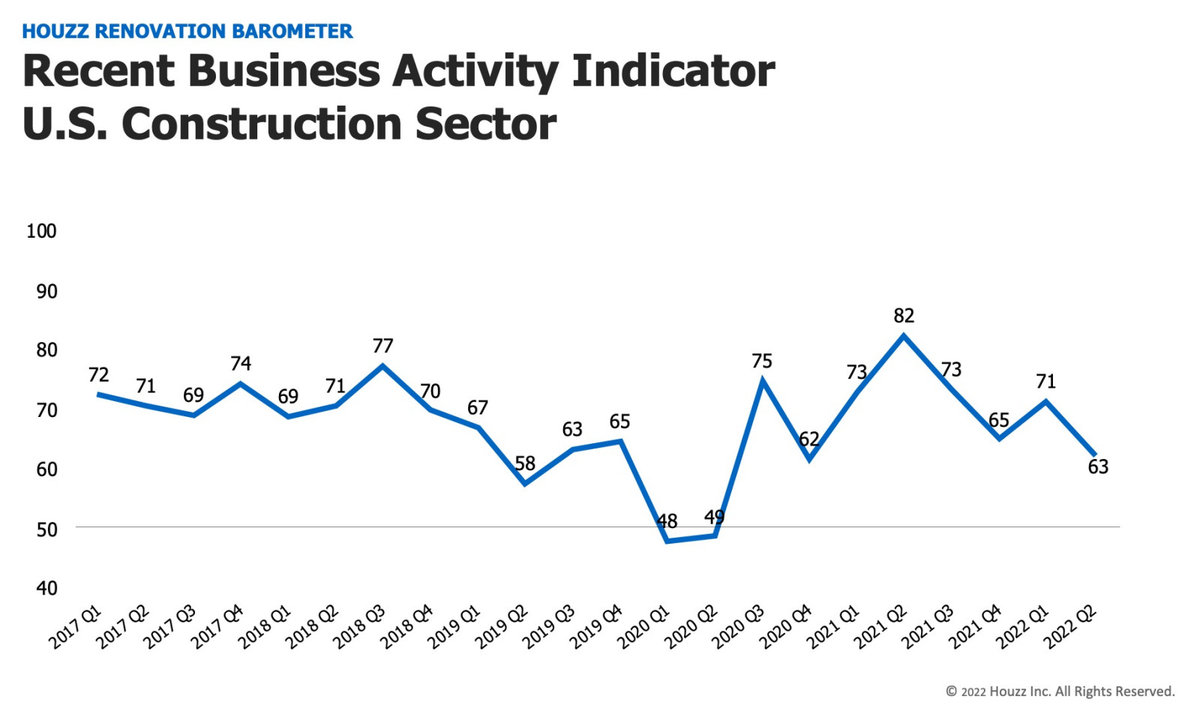
3. Recent business activity decreased. A decrease in new project inquiries and new committed projects in the second quarter of this year lowered the Recent Business Activity Indicator of the Barometer to 63 for construction firms, down by 8 points from the previous quarter.
Overall, the recent activity indicator for construction firms was driven by a decrease of 11 points reported by build-only remodelers (coming in at 61 in Q2 2022 compared with 72 in Q1 2022). Design-build remodelers reported a 7-point decrease in recent activity from Q1 2022, for a score of 64 in Q2 2022.
Relative to a year ago, the indicator is down significantly, by 19 points.
The Recent Business Activity Indicator looks at actual activity over the previous three months. In contrast with the Expected Business Activity and Project Backlog indicators, which look forward in time, the Recent Business Activity Indicator looks back. It’s based on survey questions about whether businesses observed an increase, decrease or no change in the actual number of project inquiries and new committed projects over the previous three months, relative to the three months before that. A score higher than 50 indicates that more firms reported increases than decreases.
Architectural and Design Firms
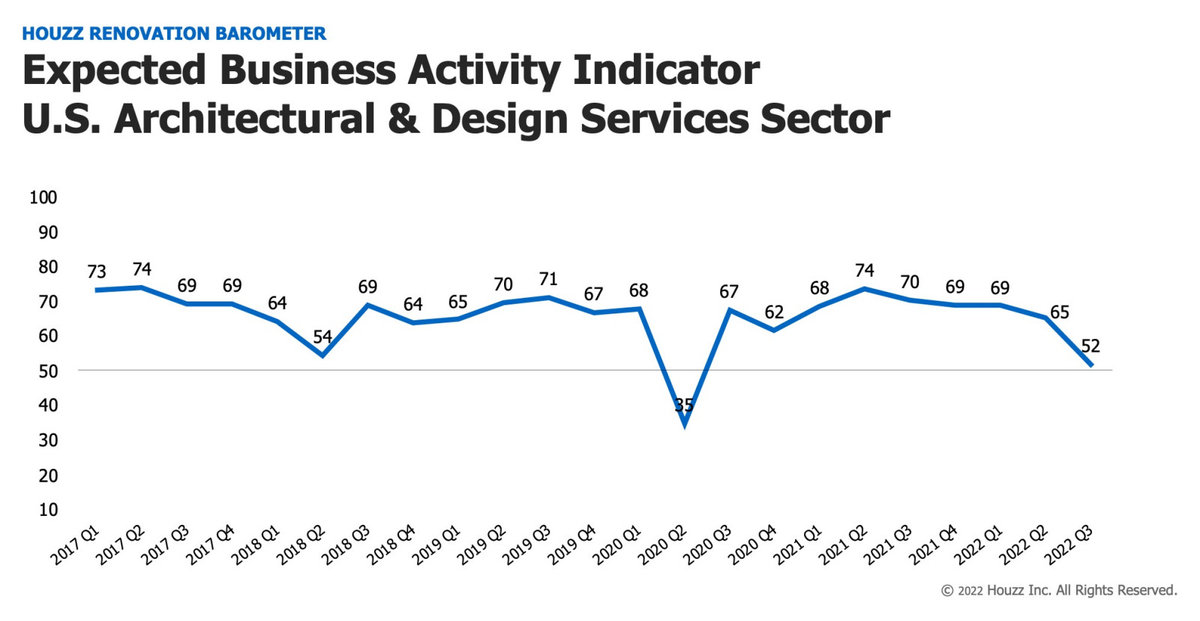
1. Business activity expectations declined significantly. The Expected Business Activity Indicator, related to project inquiries and new committed projects, decreased significantly (from 65 for Q2 2022 to 52 for Q3). This decline in expectations was driven by an 11-point drop in project inquiries (from 63 for Q2 to 52 for Q3). Expectations for new committed projects declined by an even more significant 17 points from Q2, for a score of 51.
Expectations among architects declined to 42 for the third quarter, compared with 60 for Q2. This 18-point drop puts the score below 50, which indicates that more firms reported decreases in their business activity expectations than reported increases. Though less substantially, expectations for interior designers also decreased, to 68 from 73 in Q2.
The Expected Business Activity Indicator score is now 18 points lower than a year ago, which indicates that architects and interior designers are significantly less optimistic than they were at this time last year.

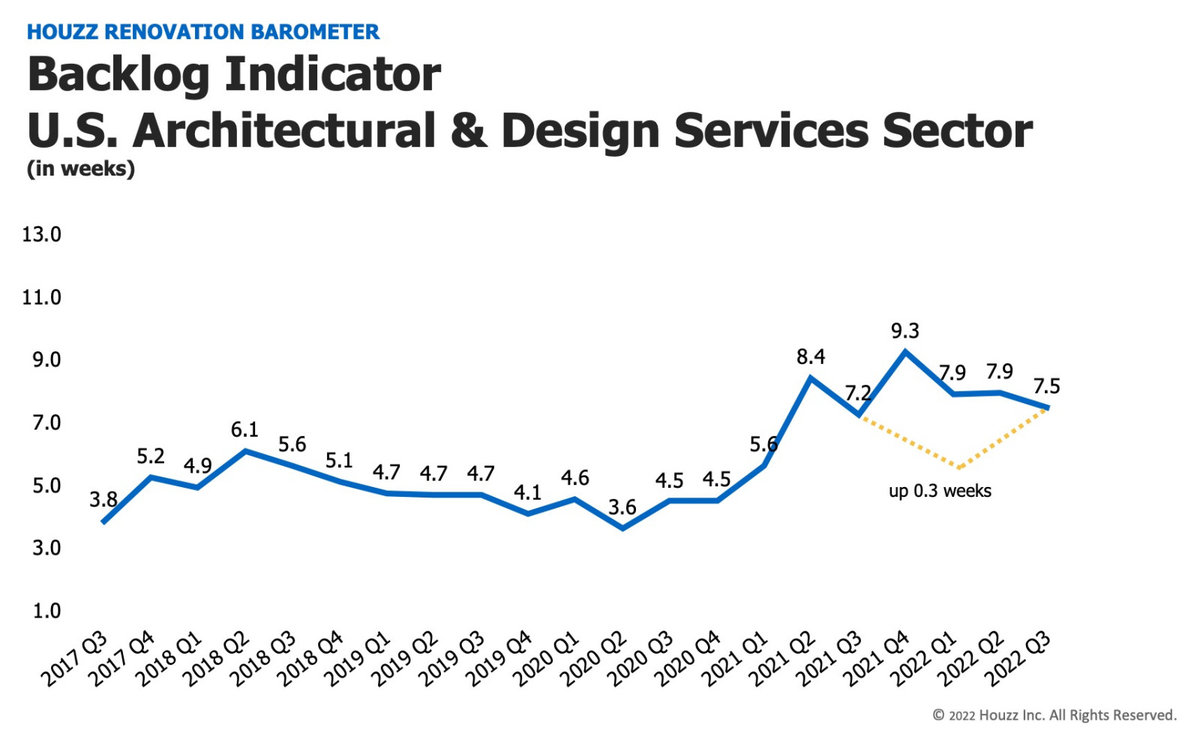
2. Wait times are shorter but remain elevated. The Project Backlog Indicator for architectural and design firms shows that wait times averaged 7.5 weeks nationally at the start of the third quarter of 2022, down 0.4 weeks compared with last quarter, when they were 7.9 weeks. Wait times are up 0.3 weeks compared with a year ago, when they averaged 7.2 weeks.
Taking a closer look by business type, architects reported wait times of 8.8 weeks to take on a new midsize project (up 2.3 weeks relative to Q3 2021). Interior designers reported wait times of 5.3 weeks (down 3.2 weeks relative to Q3 2021).
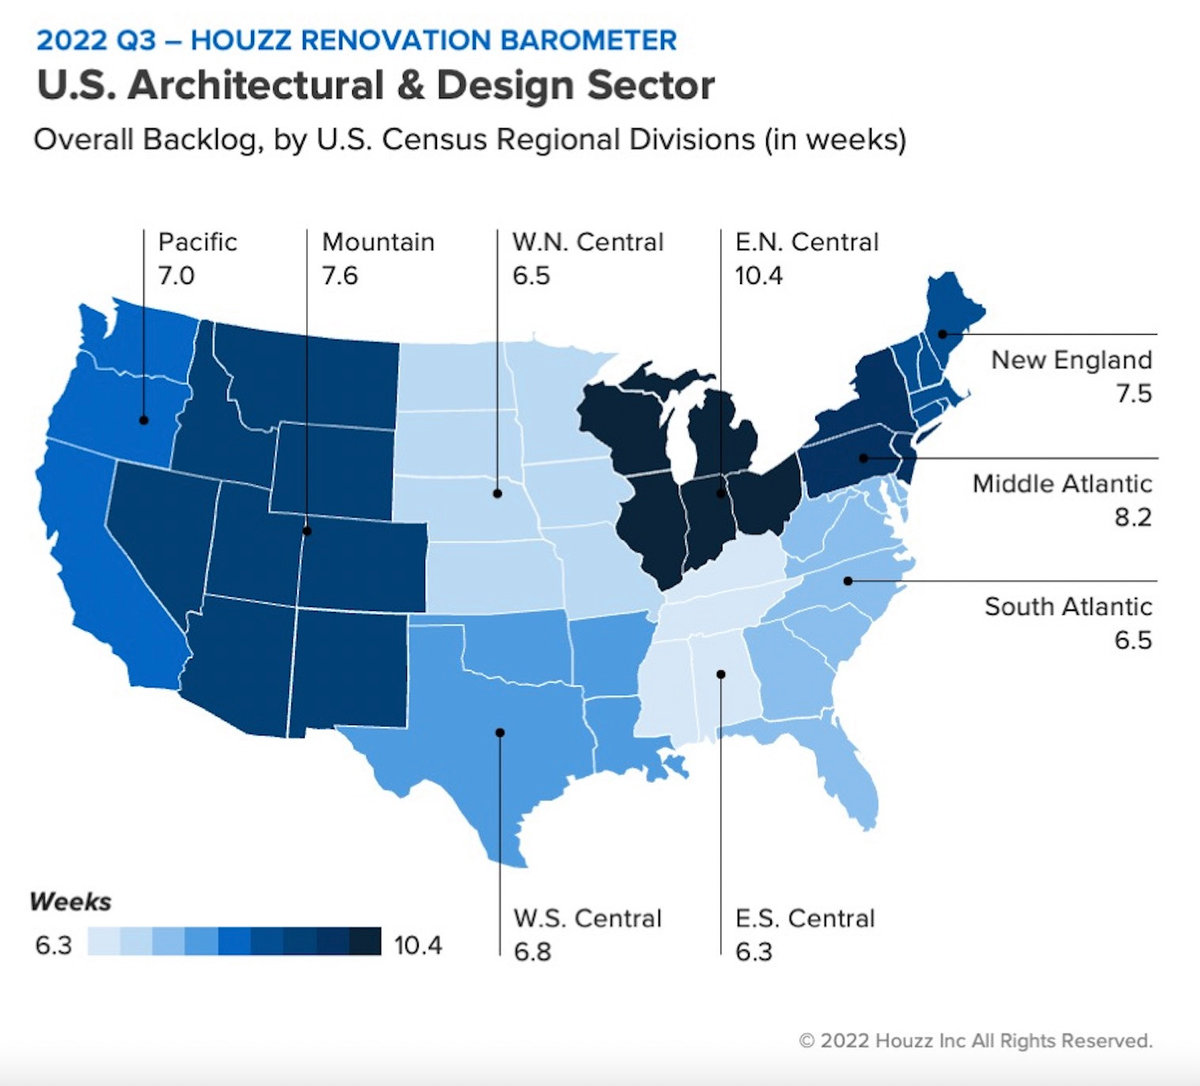
Again, backlogs vary by region, as this map shows. The East South Central division of the U.S. (Alabama, Kentucky, Mississippi, Tennessee) has the shortest average wait time (6.3 weeks), while the East North Central division of the U.S. (Illinois, Indiana, Michigan, Ohio, Wisconsin) has the longest (10.4 weeks).
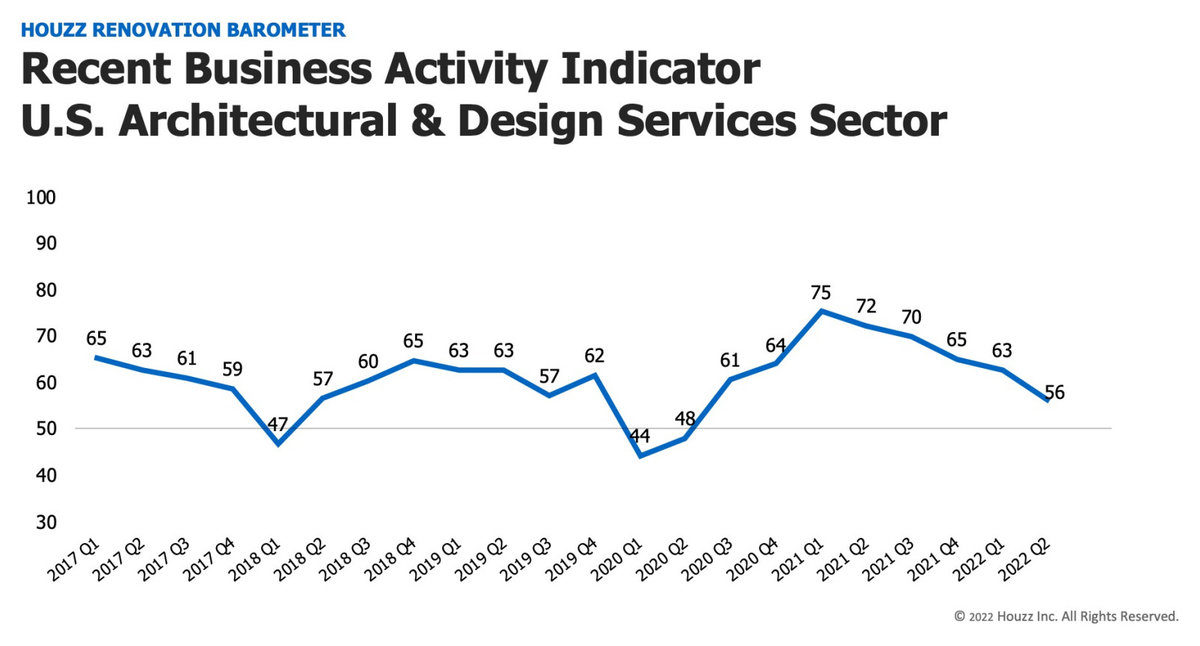
3. Recent business activity decreased. Architecture and design firms saw a decline in recent project inquiries and new committed projects in the second quarter of this year. Their score for the Recent Business Activity Indicator of the Barometer decreased by 7 points, to 56, from the previous quarter.
Among the two business groups, architects reported an 8-point decline (53 in Q2 2022 versus 61 in Q1) and interior designers reported a 4-point decline (62 in Q2 2022 versus 66 in Q1).
Year over year, the indicator is down 16 points, indicating that business activity has declined since the same time last year.

The Houzz Renovation Barometer is based on a quarterly online survey sent to a national panel of U.S. businesses with profiles on Houzz. The Barometer includes three components: Expected Business Activity, Recent Business Activity and Project Backlog (wait time). Expectation and business activity data is smoothed out to allow for predictable seasonal fluctuations, while wait-time data is not.
If you’re a pro and would like to offer your insights on market conditions in your area by joining the Barometer panel, please click here.

Want advice delivered to your inbox?
Unlock industry insights and updates for contractors and design pros
By signing up, I agree to the Houzz Terms of Use and Privacy Policy and that Houzz may use my information to contact me about relevant content, products, and services.


Join the conversation by commenting or asking a question below. The Houzz team reads every single comment, and we’ll get back to you by email if you need us!