
Search results for "Analyzing data" in Home Design Ideas





Find the right local pro for your project



 KD Designs Custom Interiors
Home office - transitional built-in desk dark wood floor and brown floor home office idea in Baltimore with white walls

 VMI architecture
The project site is a three story apartment building with a full basement, which had recently been subject to an apartment fire. Four separate residential units were contained in the structure, including one two bedroom unit and three single bedroom units. A laundry room/basement and a pair of lofts were also housed within the building. The result of the blaze and the subsequent water damage from attempts to extinguish it left the interior of the building primarily gutted. All interior finishes, fixtures, stairways, mechanical and electrical systems were destroyed beyond repair. The exterior of the building was charred in some places, and destroyed completely in others.
The project location, the City of San Rafael, determined that due to the extent of the damage to the structure, the resulting project would be considered a “new building”. Our first task was to review the current building code and apply the current regulations to the existing structure (originally built in the early 1900’s) and bring it up to current code. We performed occupant load calculations, a code summary, square footage calculations and egress code analysis for each floor/use. This information was then compiled in order to determine how the project could legally be designed within the current code, all while minimizing modifications to the existing structure.
Once all data had been analyzed, the new floor plans were organized and laid out in a manner which retained the heritage of the original building while remaining true to current code. The site was revised to allow for code compliant parking areas while retaining the family friendly outdoor spaces inherent in the original design. The foundation was reinforced, and the building structure as a whole was strengthened to cope with modern seismic loads. Spray foam insulation, low E glazing, skylights, ceiling fans, high efficiency HVAC, etc…were all added to make the building more efficient and environmentally friendly. The use of Class “A” materials, fire separations (both vertical and horizontal) and a commercial sprinkler system were employed in order to avoid any future fires. Reconstruction of the project was recently completed in the summer of 2014.
Photos by B. James

 Mayflower Construction Group
Analyzing Market Data to Optimize Your Bathroom Remodeling Budget in the Washington DC Metropolitan Area.
Are you planning a bathroom renovation project and want to make sure you're making the most of your money? Let's take a closer look at some market data and numerical recommendations to help you understand the cost distribution, and make informed decisions on where to allocate your resources.
Use the QR code or link below to read the full blog.
Link: https://mayflowerva.com/how-much-should-i-spend-on-my-small-bathrooms/
#kitchens #bathrooms #kitchenrenovations #bathroomrenovations #homeimprovement #kitchenrenovations #construction #vienna #dmv
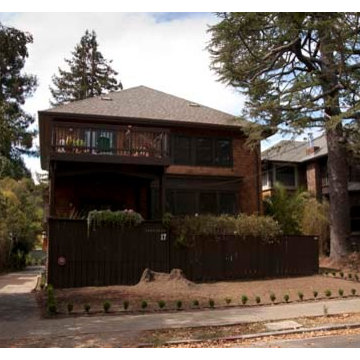 VMI architecture
The project site is a three story apartment building with a full basement, which had recently been subject to an apartment fire. Four separate residential units were contained in the structure, including one two bedroom unit and three single bedroom units. A laundry room/basement and a pair of lofts were also housed within the building. The result of the blaze and the subsequent water damage from attempts to extinguish it left the interior of the building primarily gutted. All interior finishes, fixtures, stairways, mechanical and electrical systems were destroyed beyond repair. The exterior of the building was charred in some places, and destroyed completely in others.
The project location, the City of San Rafael, determined that due to the extent of the damage to the structure, the resulting project would be considered a “new building”. Our first task was to review the current building code and apply the current regulations to the existing structure (originally built in the early 1900’s) and bring it up to current code. We performed occupant load calculations, a code summary, square footage calculations and egress code analysis for each floor/use. This information was then compiled in order to determine how the project could legally be designed within the current code, all while minimizing modifications to the existing structure.
Once all data had been analyzed, the new floor plans were organized and laid out in a manner which retained the heritage of the original building while remaining true to current code. The site was revised to allow for code compliant parking areas while retaining the family friendly outdoor spaces inherent in the original design. The foundation was reinforced, and the building structure as a whole was strengthened to cope with modern seismic loads. Spray foam insulation, low E glazing, skylights, ceiling fans, high efficiency HVAC, etc…were all added to make the building more efficient and environmentally friendly. The use of Class “A” materials, fire separations (both vertical and horizontal) and a commercial sprinkler system were employed in order to avoid any future fires. Reconstruction of the project was recently completed in the summer of 2014.
Photos by B. James

 safe ZOnea
If you’re active on GardenWeb sharing plant photos, asking for advice, tracking seasonal progress you already understand how much detail goes into gardening. Soil pH, rainfall, emerging leaves, bloom counts, fertilizer schedules it adds up fast. But all that rich information often remains buried in posts, lists or memory. What if you could visualize that data and turn it into clear quick insights? That’s where a graph maker becomes a game-changer for your gardening workflow.
1. Why garden data belongs on a graph
On GardenWeb, you’ll find forums for everything from perennial care, vegetable gardening, patios, herbs, even cooking and craft projects. While plant lovers share observations and ask questions, many track progress manually in spreadsheets or memory. A graph maker flips that around:
Instead of a list of numbers (e.g., “Soil test: pH 6.4 in May, 6.1 in October”), you get a line graph showing the decline over time.
Instead of guessing which plant bloomed most, you see a bar chart comparing counts across plants.
Instead of manually calculating average rainfall effect, you plot scatter points of bloom count vs. rainfall.
By turning your data into visuals, you’re not just recording—you’re analysing, learning and improving. For GardenWeb users this means smarter decisions: Which fertilizer actually improves bloom count? Which shady spot recovers slower? A graph maker gives clarity.
2. What is a graph maker and how to use one
A graph maker is a web tool or software that lets you input raw data (numbers, dates, categories) and output visual charts like line graphs, bar charts, scatter plots, etc. It might allow you to import a spreadsheet, select chart type, customize colours, label axes, and export the image for your blog, forum post or personal log.
Here’s how you could apply it for gardening:
Log blooms per week for each rose plant.
Using the graph maker, choose line graph to track changes over weeks.
Label your y-axis “Number of Blooms”, x-axis “Week of Year”.
Add colour lines for each plant for easy comparison.
Export as PNG and embed it in a GardenWeb forum post: “See bloom trend for my ‘Peace’ vs ‘Knock Out’ roses”.
This isn’t just pretty-to-look-at: it makes the trend obvious, invites discussion (“Hey, your ‘Knock Out’ line dips after week 28—what changed?”) and helps you refine your routine.
3. Use these specific scenarios on GardenWeb
A. Soil pH and plant health tracking
After multiple tests you have pH values over time and bloom results. Upload both datasets into the graph maker, produce a dual-axis line graph: soil pH on one axis, bloom count on the other. Post your findings in the “Soil, Fertility & Nutrients” forum and get feedback.
B. Seasonal pest or disease appearance
Record number of aphids spotted each month and whether you used treatment. A bar chart via the graph maker can show pre- and post-treatment figures. Then ask the “Insect & Disease Control” forum for advice based on your visual data.
C. Yield comparison between varieties
You grow two zucchini varieties. You keep weekly yield in pounds. Use the graph maker for a side-by-side bar chart. Share in the “Vegetable Gardening” forum: “Which was better this year? See the chart”.
D. Rainfall vs growth rate
You log weekly rainfall and growth (in cm) of your tomato plants. Use scatter plot in graph maker. If a pattern emerges, you’re ready to post: “Is my growth plateau due to drought? Chart shows a clear correlation.”
4. Why this elevates your GardenWeb contributions
When you post with a chart made by a graph maker, you’re doing more than asking or showing off. You’re investigating. You’re analysing. You invite the community to give feedback on data, not just anecdotes. That elevates the discussion. Instead of “My plant died, any ideas?” you post “See this graph of pH drop and bloom count—what might be the limiting factor?” High-quality visuals raise your post’s value and garner more thoughtful responses.
Plus, your posts become useful references for others: someone else can say, “Cool graphic, can you share your data sheet?” You build credibility and help the forum become a learning hub—not just a Q&A board.
5. Tips for using a graph maker effectively in the GardenWeb context
Keep it simple: One chart, one insight. Don’t overcrowd.
Label clearly: Titles, axis labels, units (e.g., cm/week, mg/L, °F).
Use readable colours: Avoid faint tones that vanish on mobile.
Annotate when needed: Add notes like “Fertiliser switched week 12” or “Shade cloth added”.
Provide context in your post: Don’t leave the chart alone—write a few sentences explaining what it shows and what you’re seeking.
Embed carefully: Make sure your image displays properly in GardenWeb; check mobile view.
Share raw data: If possible link to your spreadsheet so others can replicate or comment.
Be open to feedback: The chart invites questions; embrace them.
6. Possible pitfalls and how to avoid them
Bad data = bad chart: If your measurements aren’t consistent, your graph will mislead. Use standardized data collection.
Too much complexity: Multi-axis charts, too many variables—confusing. Stick to one or two variables.
Overlooking mobile viewers: Many GardenWeb users browse via phones. Use large fonts and simple visuals.
Ignoring the narrative: Chart alone won’t answer. Explain what it means and what you need.
Outdated charts: If you update your data annually, keep your visuals current or label them clearly as “2024 data”.
7. Final thoughts
On GardenWeb you’ll find a vibrant community of gardeners, DIYers, cooks and design lovers.Using a graph maker for your posts and progress turns your experience from casual hobby-logging into smart data-driven gardening. You’ll not only learn more—your peers will learn more, too.
So next time you log your plant growth, record your yield, test your soil or track pests—don’t just note it. Plot it. Use a graph maker. Share it in the forum. Let your garden tell the story, and let the community help you write the next chapter.
 SS
SSTop Real Estate App Development Companies Delivering Smart PropTech Solutions
The real estate industry is experiencing a revolution in technology as there have been developments in the form of mobile applications, which have now become essential tools and prove to be an integral part for buyers and sellers as well as agents and developers in this industry. The application of technology in the form of virtual tours and property recommendations through artificial intelligence and other such technology has brought about a new way of doing real estate business. It has been found out through statistics that the PropTech industry will experience considerable growth in the next decade due to the increased use of smartphones, cloud computing, and artificial intelligence.
Why Real Estate Apps Are Transforming the PropTech Industry
The introduction of digital platforms has revolutionized the way people search for, assess, and buy properties. Modern real estate software ensures easy access to property listings, neighborhood information, mortgage calculators, virtual tours, and direct contact with real estate agents, thus cutting out many of the obstacles that were part of the purchasing process. Real Estate App Development allows companies to manage properties efficiently, automatically generate leads, effectively handle customers, and make informed decisions. The inclusion of artificial intelligence and digital transactions makes the experience of using these apps even more efficient.
List of Top Real Estate App Development Companies in the Global Market
1. Suffescom Solutions
Suffescom Solutions is a mobile app development company specializing in Real Estate App Development for startups, real estate agencies, property management firms, and enterprises. The company develops scalable, feature-rich applications that simplify property discovery, virtual tours, lead management, and secure digital transactions. By integrating advanced technologies such as AI, AR/VR, cloud computing, and location intelligence, Suffescom Solutions helps businesses build intuitive PropTech platforms that enhance customer engagement and operational efficiency. The company also focuses on customization, security, and post-launch support to ensure long-term business success.
Key Features
Custom real estate application development
AI-powered property recommendations
Property listing management
Interactive map integration
Virtual property tours
CRM integration
Secure payment gateway
Multi-platform development
Cloud-native architecture
Maintenance and support
2. RisingMax
RisingMax develops innovative digital solutions for businesses seeking advanced PropTech platforms. Its expertise in Real Estate App Development enables companies to launch scalable property applications equipped with intelligent search capabilities, real-time property updates, and secure communication tools. RisingMax combines modern UI/UX practices with cloud technologies to deliver applications that improve customer engagement and simplify property management.
Key Features
Cross-platform app development
AI-enabled property search
Property management dashboard
Cloud deployment
Push notifications
Digital payment integration
Analytics and reporting
API integration
Secure authentication
Ongoing technical support
3. Ascendix Technologies
Ascendix Technologies is known for developing enterprise-grade PropTech software for commercial and residential real estate businesses. The company focuses on building customized applications that streamline property management, brokerage operations, customer engagement, and business workflows. Its expertise includes CRM development, cloud solutions, and data analytics, enabling businesses to manage property portfolios more efficiently.
Key Features
Enterprise real estate solutions
CRM integration
Commercial property management
Cloud infrastructure
Advanced analytics
Workflow automation
Custom software development
Secure data management
API connectivity
Long-term support
4. WillowTree
WillowTree develops premium mobile applications across various industries, including real estate and digital commerce. The company creates user-centric property applications that emphasize intuitive navigation, personalized property recommendations, and engaging digital experiences. Its development approach combines robust engineering with modern design principles to build scalable PropTech platforms for growing businesses.
Key Features
Mobile-first development
Personalized user experience
Property search optimization
Cloud-native architecture
Interactive UI/UX
Analytics integration
Secure user authentication
Multi-device compatibility
Third-party integrations
Continuous optimization
5. Unico Connect
Unico Connect specializes in delivering customized digital products for startups and enterprises, including Real Estate App Development solutions. The company builds scalable applications that simplify property listings, communication, lead management, and customer engagement while integrating cloud technologies for improved business performance.
Key Features
Custom property applications
Cloud-based infrastructure
Real-time messaging
Lead management system
Property listing platform
API integration
Digital documentation
Performance analytics
Secure payment integration
Ongoing maintenance
6. Trango Tech
Trango Tech develops intelligent mobile solutions that help real estate businesses digitize property management and customer interactions. Its applications support advanced search functionality, location-based services, secure transactions, and AI-powered recommendations. The company focuses on scalable software architecture that supports long-term business growth and operational efficiency.
Key Features
Property marketplace development
AI-powered recommendations
Interactive map integration
GPS-enabled search
Digital document management
User analytics
Cross-platform applications
Secure backend systems
CRM connectivity
Cloud deployment
7. MindInventory
MindInventory is a software development company delivering digital transformation solutions across multiple industries, including real estate. Its Real Estate App Development services include modern property applications that combine intuitive interfaces with advanced technologies such as AI, IoT, and cloud computing. The company focuses on creating engaging user experiences while ensuring scalability, security, and seamless business operations.
Key Features
AI-enabled property applications
Cloud-native development
Property management tools
Interactive dashboards
IoT integration
User engagement features
Third-party API integration
Business intelligence reporting
Secure infrastructure
Continuous technical support
Essential Features Every Modern Real Estate App Should Include
Successful Real Estate App Development requires more than attractive property listings. Modern applications must provide seamless experiences for buyers, sellers, agents, and property managers while simplifying transactions and communication.
• User Registration and Profile Management
Allow buyers, sellers, agents, and administrators to create personalized accounts with secure authentication and profile customization.
• Advanced Property Search
Provide powerful filters based on location, property type, price range, amenities, size, and availability to improve property discovery.
• Interactive Maps
Integrate GPS-enabled maps that display nearby schools, hospitals, transportation hubs, restaurants, and neighborhood information.
• High-Quality Property Listings
Support multiple images, HD videos, floor plans, property specifications, and detailed descriptions for each listing.
• Virtual Tours
Enable immersive 360-degree property walkthroughs using AR/VR technology to improve buyer confidence before physical visits.
• AI-Powered Property Recommendations
Use artificial intelligence to recommend properties based on user preferences, browsing behavior, and previous searches.
• Real-Time Chat and Messaging
Facilitate instant communication between buyers, sellers, and agents for faster inquiry resolution.
• Mortgage Calculator
Help users estimate monthly payments, loan eligibility, and financing options directly within the application.
• Appointment Scheduling
Allow users to schedule property visits, virtual meetings, or consultations with agents through integrated calendars.
• Secure Digital Payments
Support booking fees, deposits, subscription payments, and service charges through encrypted payment gateways.
• Document Management
Store contracts, agreements, ownership documents, inspection reports, and legal paperwork securely within the application.
• Push Notifications
Notify users about new listings, price changes, scheduled visits, document approvals, and promotional offers.
• Admin Dashboard
Provide centralized control over users, listings, transactions, content moderation, analytics, and platform management.
• Analytics and Reporting
Offer detailed insights into customer behavior, listing performance, lead generation, conversions, and revenue growth.
• Strong Security
Implement encrypted communications, secure authentication, role-based access control, data privacy measures, and regulatory compliance.
Emerging Trends Shaping the Future of Real Estate App Development
The future of Real Estate App Development is being driven by intelligent technologies that improve decision-making, customer experiences, and operational efficiency throughout the property lifecycle.
Artificial intelligence is transforming property discovery by delivering personalized recommendations, predictive pricing models, and automated customer support. Machine learning algorithms analyze user preferences and market trends to recommend relevant properties while helping businesses generate qualified leads more effectively.
Augmented reality (AR) and virtual reality (VR) are becoming essential components of digital property experiences. Virtual property tours allow buyers to explore homes remotely, reducing travel time and accelerating purchasing decisions.
Another significant trend is IoT integration within smart properties. Connected devices enable users to monitor energy consumption, security systems, lighting, and climate control directly through mobile applications, enhancing property value and user convenience.
Finally, sustainability is becoming an important focus. Modern real estate platforms increasingly highlight green-certified buildings, energy-efficient homes, and environmentally friendly construction projects to meet changing buyer preferences.
Conclusion
The rapid evolution of the PropTech sector has made Real Estate App Development an essential investment for businesses aiming to deliver seamless, technology-driven property experiences. From AI-powered property recommendations and immersive virtual tours to secure digital transactions and cloud-based management systems, modern applications are transforming every stage of the real estate journey. Selecting an experienced development company with expertise in emerging technologies, scalable architecture, and user-centric design is crucial for building a competitive digital platform. As customer expectations continue to evolve, organizations that invest in innovative real estate applications will be better positioned to improve operational efficiency, strengthen customer relationships, and achieve long-term growth in the digital property marketplace.
FAQs
1. What is Real Estate App Development?
Real Estate App Development involves building mobile or web applications that help users buy, sell, rent, and manage properties through digital platforms.
2. How much does Real Estate App Development cost?
Development costs vary based on features, platforms, integrations, UI/UX complexity, and technology requirements, ranging from basic to enterprise-grade solutions.
3. Which features are essential in a real estate app?
Core features include property listings, advanced search, virtual tours, GPS maps, messaging, appointment scheduling, payment integration, and analytics dashboards.
4. Why should businesses invest in Real Estate App Development?
It enhances customer engagement, streamlines property management, increases lead generation, supports digital transactions, and helps businesses stay competitive in the evolving PropTech market.

 Mobilify
iPad App Development
Ever since the launch of the first iPad in 2010, the device has taken the world by storm. An iPad app with profit enhancing features is the best way to increase productivity. Hiring an iPad app development company which offers customized app development for iPad, would be the best idea for business as well as personal use.
Why Choose Us?
Proficiency: we have a team of highly skilled and experienced workers who have the complete knowledge of iPad and are aware of what would suit the needs of the customer.
Cost Effective: we design iPad apps as per your budget and provide flexible payment options too.
On-time Results: we deliver results within the given time frame without any delay.
100% safety Guaranteed: We guarantee the complete safety of your data with us.
Analysis: we analyse the need of the customer and design the app accordingly after taking inputs on the same.
Innovative and Unique Features: we develop iPad apps with unique and innovative features to match the global standards.
Detailed knowledge: The team also has detailed knowledge of the pros and cons of the Apple software used in iPads like iOS SDK, programming tools like XCode IDE and interface builder, core audio, core animation, WebKit programming, core location framework etc.
Apps for various sections: we develop iPad apps for various sections of the society like shopping apps, food apps, education apps, fashion apps, social media apps, travel apps, book apps, lifestyle apps, real estate apps etc.
We have expertise and experience in application development and are proficient with all the modern day technologies to offer the best app experiences for Android, iPhone, iPad, Windows and Blackberry. We design applications to boost the profitability rate. www.mobilify.my
1