
Search results for "Improved data" in Home Design Ideas
 Lush Interiors Inc.
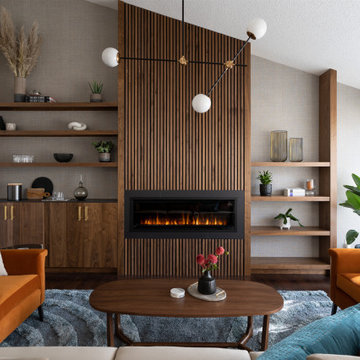
Living room - small mid-century modern enclosed wallpaper, dark wood floor and brown floor living room idea in Calgary with a standard fireplace, a wood fireplace surround, white walls and no tv

 ZeroEnergy Design
Lincoln Farmhouse
LEED-H Platinum, Net-Positive Energy
OVERVIEW. This LEED Platinum certified modern farmhouse ties into the cultural landscape of Lincoln, Massachusetts - a town known for its rich history, farming traditions, conservation efforts, and visionary architecture. The goal was to design and build a new single family home on 1.8 acres that respects the neighborhood’s agrarian roots, produces more energy than it consumes, and provides the family with flexible spaces to live-play-work-entertain. The resulting 2,800 SF home is proof that families do not need to compromise on style, space or comfort in a highly energy-efficient and healthy home.
CONNECTION TO NATURE. The attached garage is ubiquitous in new construction in New England’s cold climate. This home’s barn-inspired garage is intentionally detached from the main dwelling. A covered walkway connects the two structures, creating an intentional connection with the outdoors between auto and home.
FUNCTIONAL FLEXIBILITY. With a modest footprint, each space must serve a specific use, but also be flexible for atypical scenarios. The Mudroom serves everyday use for the couple and their children, but is also easy to tidy up to receive guests, eliminating the need for two entries found in most homes. A workspace is conveniently located off the mudroom; it looks out on to the back yard to supervise the children and can be closed off with a sliding door when not in use. The Away Room opens up to the Living Room for everyday use; it can be closed off with its oversized pocket door for secondary use as a guest bedroom with en suite bath.
NET POSITIVE ENERGY. The all-electric home consumes 70% less energy than a code-built house, and with measured energy data produces 48% more energy annually than it consumes, making it a 'net positive' home. Thick walls and roofs lack thermal bridging, windows are high performance, triple-glazed, and a continuous air barrier yields minimal leakage (0.27ACH50) making the home among the tightest in the US. Systems include an air source heat pump, an energy recovery ventilator, and a 13.1kW photovoltaic system to offset consumption and support future electric cars.
ACTUAL PERFORMANCE. -6.3 kBtu/sf/yr Energy Use Intensity (Actual monitored project data reported for the firm’s 2016 AIA 2030 Commitment. Average single family home is 52.0 kBtu/sf/yr.)
o 10,900 kwh total consumption (8.5 kbtu/ft2 EUI)
o 16,200 kwh total production
o 5,300 kwh net surplus, equivalent to 15,000-25,000 electric car miles per year. 48% net positive.
WATER EFFICIENCY. Plumbing fixtures and water closets consume a mere 60% of the federal standard, while high efficiency appliances such as the dishwasher and clothes washer also reduce consumption rates.
FOOD PRODUCTION. After clearing all invasive species, apple, pear, peach and cherry trees were planted. Future plans include blueberry, raspberry and strawberry bushes, along with raised beds for vegetable gardening. The house also offers a below ground root cellar, built outside the home's thermal envelope, to gain the passive benefit of long term energy-free food storage.
RESILIENCY. The home's ability to weather unforeseen challenges is predictable - it will fare well. The super-insulated envelope means during a winter storm with power outage, heat loss will be slow - taking days to drop to 60 degrees even with no heat source. During normal conditions, reduced energy consumption plus energy production means shelter from the burden of utility costs. Surplus production can power electric cars & appliances. The home exceeds snow & wind structural requirements, plus far surpasses standard construction for long term durability planning.
ARCHITECT: ZeroEnergy Design http://zeroenergy.com/lincoln-farmhouse
CONTRACTOR: Thoughtforms http://thoughtforms-corp.com/
PHOTOGRAPHER: Chuck Choi http://www.chuckchoi.com/
 Agius Design and Interiors
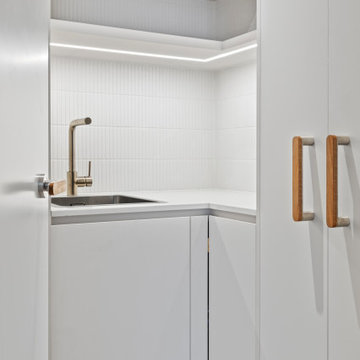
The Laundry renovation underwent an entire strip out whilst maintaining the electrical and data cupboard position. The design improved amenity to create a user friendly small space.
Find the right local pro for your project
 Agius Design and Interiors
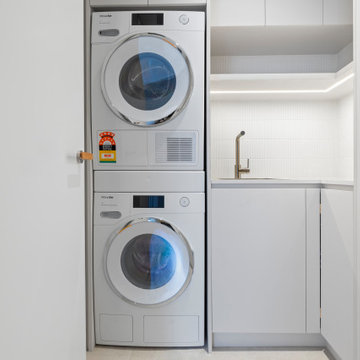
The Laundry renovation underwent an entire strip out whilst maintaining the electrical and data cupboard position. The design improved amenity to create a user friendly small space.

 Alair Homes Phoenix
This office tenant improvement project includes an open bull pen area, reception area, large conference/training facility featuring an interior garage door to open increased space. The facility boasts a world class data infrastructure system enabling state agencies and international providers to create a smarter and more efficient credentialing exchange. This project was completed on budget and on time
 Alair Homes Phoenix
This office tenant improvement project includes an open bullpen area, reception area, large conference/training facility featuring an interior garage door to open increased space. The facility boasts a world class data infrastructure system enabling state agencies and international providers to create a smarter and more efficient credentialing exchange. This project was completed on budget and on time
 Alair Homes Phoenix
This office tenant improvement project includes an open bullpen area, reception area, large conference/training facility featuring an interior garage door to open increased space. The facility boasts a world class data infrastructure system enabling state agencies and international providers to create a smarter and more efficient credentialing exchange. This project was completed on budget and on time

 Alair Homes Phoenix
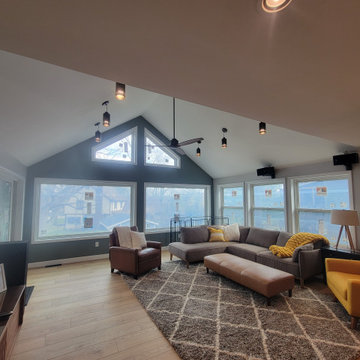
This office tenant improvement project includes an open bullpen area, reception area, large conference/training facility featuring an interior garage door to open increased space. The facility boasts a world class data infrastructure system enabling state agencies and international providers to create a smarter and more efficient credentialing exchange. This project was completed on budget and on time
 Alair Homes Phoenix
This office tenant improvement project includes an open bullpen area, reception area, large conference/training facility featuring an interior garage door to open increased space. The facility boasts a world class data infrastructure system enabling state agencies and international providers to create a smarter and more efficient credentialing exchange. This project was completed on budget and on time
 Alair Homes Phoenix
This office tenant improvement project includes an open bullpen area, reception area, large conference/training facility featuring an interior garage door to open increased space. The facility boasts a world class data infrastructure system enabling state agencies and international providers to create a smarter and more efficient credentialing exchange. This project was completed on budget and on time
 Alair Homes Phoenix
This office tenant improvement project includes an open bullpen area, reception area, large conference/training facility featuring an interior garage door to open increased space. The facility boasts a world class data infrastructure system enabling state agencies and international providers to create a smarter and more efficient credentialing exchange. This project was completed on budget and on time


 Alair Homes Phoenix
This office tenant improvement project includes an open bullpen area, reception area, large conference/training facility featuring an interior garage door to open increased space. The facility boasts a world class data infrastructure system enabling state agencies and international providers to create a smarter and more efficient credentialing exchange. This project was completed on budget and on time
 Alair Homes Phoenix
This office tenant improvement project includes an open bullpen area, reception area, large conference/training facility featuring an interior garage door to open increased space. The facility boasts a world class data infrastructure system enabling state agencies and international providers to create a smarter and more efficient credentialing exchange. This project was completed on budget and on time

 Inhabit | Space
Whon Photography
Large urban underground carpeted staircase photo in Indianapolis with gray walls and no fireplace
Large urban underground carpeted staircase photo in Indianapolis with gray walls and no fireplace



 safe ZOnea
If you’re active on GardenWeb sharing plant photos, asking for advice, tracking seasonal progress you already understand how much detail goes into gardening. Soil pH, rainfall, emerging leaves, bloom counts, fertilizer schedules it adds up fast. But all that rich information often remains buried in posts, lists or memory. What if you could visualize that data and turn it into clear quick insights? That’s where a graph maker becomes a game-changer for your gardening workflow.
1. Why garden data belongs on a graph
On GardenWeb, you’ll find forums for everything from perennial care, vegetable gardening, patios, herbs, even cooking and craft projects. While plant lovers share observations and ask questions, many track progress manually in spreadsheets or memory. A graph maker flips that around:
Instead of a list of numbers (e.g., “Soil test: pH 6.4 in May, 6.1 in October”), you get a line graph showing the decline over time.
Instead of guessing which plant bloomed most, you see a bar chart comparing counts across plants.
Instead of manually calculating average rainfall effect, you plot scatter points of bloom count vs. rainfall.
By turning your data into visuals, you’re not just recording—you’re analysing, learning and improving. For GardenWeb users this means smarter decisions: Which fertilizer actually improves bloom count? Which shady spot recovers slower? A graph maker gives clarity.
2. What is a graph maker and how to use one
A graph maker is a web tool or software that lets you input raw data (numbers, dates, categories) and output visual charts like line graphs, bar charts, scatter plots, etc. It might allow you to import a spreadsheet, select chart type, customize colours, label axes, and export the image for your blog, forum post or personal log.
Here’s how you could apply it for gardening:
Log blooms per week for each rose plant.
Using the graph maker, choose line graph to track changes over weeks.
Label your y-axis “Number of Blooms”, x-axis “Week of Year”.
Add colour lines for each plant for easy comparison.
Export as PNG and embed it in a GardenWeb forum post: “See bloom trend for my ‘Peace’ vs ‘Knock Out’ roses”.
This isn’t just pretty-to-look-at: it makes the trend obvious, invites discussion (“Hey, your ‘Knock Out’ line dips after week 28—what changed?”) and helps you refine your routine.
3. Use these specific scenarios on GardenWeb
A. Soil pH and plant health tracking
After multiple tests you have pH values over time and bloom results. Upload both datasets into the graph maker, produce a dual-axis line graph: soil pH on one axis, bloom count on the other. Post your findings in the “Soil, Fertility & Nutrients” forum and get feedback.
B. Seasonal pest or disease appearance
Record number of aphids spotted each month and whether you used treatment. A bar chart via the graph maker can show pre- and post-treatment figures. Then ask the “Insect & Disease Control” forum for advice based on your visual data.
C. Yield comparison between varieties
You grow two zucchini varieties. You keep weekly yield in pounds. Use the graph maker for a side-by-side bar chart. Share in the “Vegetable Gardening” forum: “Which was better this year? See the chart”.
D. Rainfall vs growth rate
You log weekly rainfall and growth (in cm) of your tomato plants. Use scatter plot in graph maker. If a pattern emerges, you’re ready to post: “Is my growth plateau due to drought? Chart shows a clear correlation.”
4. Why this elevates your GardenWeb contributions
When you post with a chart made by a graph maker, you’re doing more than asking or showing off. You’re investigating. You’re analysing. You invite the community to give feedback on data, not just anecdotes. That elevates the discussion. Instead of “My plant died, any ideas?” you post “See this graph of pH drop and bloom count—what might be the limiting factor?” High-quality visuals raise your post’s value and garner more thoughtful responses.
Plus, your posts become useful references for others: someone else can say, “Cool graphic, can you share your data sheet?” You build credibility and help the forum become a learning hub—not just a Q&A board.
5. Tips for using a graph maker effectively in the GardenWeb context
Keep it simple: One chart, one insight. Don’t overcrowd.
Label clearly: Titles, axis labels, units (e.g., cm/week, mg/L, °F).
Use readable colours: Avoid faint tones that vanish on mobile.
Annotate when needed: Add notes like “Fertiliser switched week 12” or “Shade cloth added”.
Provide context in your post: Don’t leave the chart alone—write a few sentences explaining what it shows and what you’re seeking.
Embed carefully: Make sure your image displays properly in GardenWeb; check mobile view.
Share raw data: If possible link to your spreadsheet so others can replicate or comment.
Be open to feedback: The chart invites questions; embrace them.
6. Possible pitfalls and how to avoid them
Bad data = bad chart: If your measurements aren’t consistent, your graph will mislead. Use standardized data collection.
Too much complexity: Multi-axis charts, too many variables—confusing. Stick to one or two variables.
Overlooking mobile viewers: Many GardenWeb users browse via phones. Use large fonts and simple visuals.
Ignoring the narrative: Chart alone won’t answer. Explain what it means and what you need.
Outdated charts: If you update your data annually, keep your visuals current or label them clearly as “2024 data”.
7. Final thoughts
On GardenWeb you’ll find a vibrant community of gardeners, DIYers, cooks and design lovers.Using a graph maker for your posts and progress turns your experience from casual hobby-logging into smart data-driven gardening. You’ll not only learn more—your peers will learn more, too.
So next time you log your plant growth, record your yield, test your soil or track pests—don’t just note it. Plot it. Use a graph maker. Share it in the forum. Let your garden tell the story, and let the community help you write the next chapter.

Sponsored
Delaware County, OH

Whisler Home Improvement
Franklin County's Committed Home Improvement Professionals

 Petroff Design Interiors + Fine Art
The kitchen island has been designed with a floating shelf that's not only ideal for food prep and acts as a buffet, but also doubles as a space for the kids to do homework. Electrical and data outlets were included in the design to ensure any task could be completed there.As well, display niches were added in every corner to help the family display a lifetime of memories and mementos without sacrificing storage space.

 Zelaya Properties LLC
We used: Custom cherry cabinetry in Arts & Crafts Shaker style by Kabinart in Boulder and Espresso stains. Liberty Hardware Venetian bronze 1-1/2" cabinet knobs. KitchenAid Architect II Series 22 CF counter-depth French door refrigerator. KitchenAid Architect Series II 27" convection single wall oven. KitchenAid 36" 6-burner dual fuel freestanding commercial-style range. KitchenAid Architect II Series 24" dishwasher. Sharp Insight Pro Series 24" built-in microwave drawer (Model #KB6524PS). Crystorama Solaris 12" wide pendant lights in English bronze. Granite countertops in Brown Fantasy. 3"x6" polished marble backsplash.
Paint colors:
Walls: Glidden Silver Cloud 30YY 63/024
Ceilings/Trims/Doors: Glidden Swan White GLC23
Robert B. Narod Photography

 Moderne Builders
Gorgeous master bath with dramatic retro "wave" tile. Peak Photography
Example of a 1950s bathroom design in Los Angeles
Example of a 1950s bathroom design in Los Angeles
1