
Search results for "Calculator" in Home Design Ideas

 safe ZOnea
If you’re active on GardenWeb sharing plant photos, asking for advice, tracking seasonal progress you already understand how much detail goes into gardening. Soil pH, rainfall, emerging leaves, bloom counts, fertilizer schedules it adds up fast. But all that rich information often remains buried in posts, lists or memory. What if you could visualize that data and turn it into clear quick insights? That’s where a graph maker becomes a game-changer for your gardening workflow.
1. Why garden data belongs on a graph
On GardenWeb, you’ll find forums for everything from perennial care, vegetable gardening, patios, herbs, even cooking and craft projects. While plant lovers share observations and ask questions, many track progress manually in spreadsheets or memory. A graph maker flips that around:
Instead of a list of numbers (e.g., “Soil test: pH 6.4 in May, 6.1 in October”), you get a line graph showing the decline over time.
Instead of guessing which plant bloomed most, you see a bar chart comparing counts across plants.
Instead of manually calculating average rainfall effect, you plot scatter points of bloom count vs. rainfall.
By turning your data into visuals, you’re not just recording—you’re analysing, learning and improving. For GardenWeb users this means smarter decisions: Which fertilizer actually improves bloom count? Which shady spot recovers slower? A graph maker gives clarity.
2. What is a graph maker and how to use one
A graph maker is a web tool or software that lets you input raw data (numbers, dates, categories) and output visual charts like line graphs, bar charts, scatter plots, etc. It might allow you to import a spreadsheet, select chart type, customize colours, label axes, and export the image for your blog, forum post or personal log.
Here’s how you could apply it for gardening:
Log blooms per week for each rose plant.
Using the graph maker, choose line graph to track changes over weeks.
Label your y-axis “Number of Blooms”, x-axis “Week of Year”.
Add colour lines for each plant for easy comparison.
Export as PNG and embed it in a GardenWeb forum post: “See bloom trend for my ‘Peace’ vs ‘Knock Out’ roses”.
This isn’t just pretty-to-look-at: it makes the trend obvious, invites discussion (“Hey, your ‘Knock Out’ line dips after week 28—what changed?”) and helps you refine your routine.
3. Use these specific scenarios on GardenWeb
A. Soil pH and plant health tracking
After multiple tests you have pH values over time and bloom results. Upload both datasets into the graph maker, produce a dual-axis line graph: soil pH on one axis, bloom count on the other. Post your findings in the “Soil, Fertility & Nutrients” forum and get feedback.
B. Seasonal pest or disease appearance
Record number of aphids spotted each month and whether you used treatment. A bar chart via the graph maker can show pre- and post-treatment figures. Then ask the “Insect & Disease Control” forum for advice based on your visual data.
C. Yield comparison between varieties
You grow two zucchini varieties. You keep weekly yield in pounds. Use the graph maker for a side-by-side bar chart. Share in the “Vegetable Gardening” forum: “Which was better this year? See the chart”.
D. Rainfall vs growth rate
You log weekly rainfall and growth (in cm) of your tomato plants. Use scatter plot in graph maker. If a pattern emerges, you’re ready to post: “Is my growth plateau due to drought? Chart shows a clear correlation.”
4. Why this elevates your GardenWeb contributions
When you post with a chart made by a graph maker, you’re doing more than asking or showing off. You’re investigating. You’re analysing. You invite the community to give feedback on data, not just anecdotes. That elevates the discussion. Instead of “My plant died, any ideas?” you post “See this graph of pH drop and bloom count—what might be the limiting factor?” High-quality visuals raise your post’s value and garner more thoughtful responses.
Plus, your posts become useful references for others: someone else can say, “Cool graphic, can you share your data sheet?” You build credibility and help the forum become a learning hub—not just a Q&A board.
5. Tips for using a graph maker effectively in the GardenWeb context
Keep it simple: One chart, one insight. Don’t overcrowd.
Label clearly: Titles, axis labels, units (e.g., cm/week, mg/L, °F).
Use readable colours: Avoid faint tones that vanish on mobile.
Annotate when needed: Add notes like “Fertiliser switched week 12” or “Shade cloth added”.
Provide context in your post: Don’t leave the chart alone—write a few sentences explaining what it shows and what you’re seeking.
Embed carefully: Make sure your image displays properly in GardenWeb; check mobile view.
Share raw data: If possible link to your spreadsheet so others can replicate or comment.
Be open to feedback: The chart invites questions; embrace them.
6. Possible pitfalls and how to avoid them
Bad data = bad chart: If your measurements aren’t consistent, your graph will mislead. Use standardized data collection.
Too much complexity: Multi-axis charts, too many variables—confusing. Stick to one or two variables.
Overlooking mobile viewers: Many GardenWeb users browse via phones. Use large fonts and simple visuals.
Ignoring the narrative: Chart alone won’t answer. Explain what it means and what you need.
Outdated charts: If you update your data annually, keep your visuals current or label them clearly as “2024 data”.
7. Final thoughts
On GardenWeb you’ll find a vibrant community of gardeners, DIYers, cooks and design lovers.Using a graph maker for your posts and progress turns your experience from casual hobby-logging into smart data-driven gardening. You’ll not only learn more—your peers will learn more, too.
So next time you log your plant growth, record your yield, test your soil or track pests—don’t just note it. Plot it. Use a graph maker. Share it in the forum. Let your garden tell the story, and let the community help you write the next chapter.



 Vineuve Construction Inc.
hand-cut penny tile corners
The Vineuve 100 is available for pre order, and will be coming to market on June 1st, 2021.
Contact us at info@vineuve.ca to sign up for pre order.
Find the right local pro for your project

 Bella Tile and Stone
Inspiration for a large contemporary master white tile and porcelain tile marble floor and white floor freestanding bathtub remodel with shaker cabinets, blue cabinets, white walls, an undermount sink, quartz countertops, a hinged shower door and gray countertops

 North Country Design & Build Inc.
Smart Storage - Small Bathroom renovation done by North Country Design & Build Inc. - Jen Schwindt
Inspiration for a contemporary bathroom remodel in Toronto
Inspiration for a contemporary bathroom remodel in Toronto


 Tamalpais Hardwood Floors
Close up view of reclaimed oak used on office wall.
Mid-sized mountain style freestanding desk dark wood floor study room photo in San Francisco with brown walls and no fireplace
Mid-sized mountain style freestanding desk dark wood floor study room photo in San Francisco with brown walls and no fireplace



 The Ranch Mine
Photo by Roehner + Ryan
Modern two-story concrete flat roof idea in Phoenix with a metal roof
Modern two-story concrete flat roof idea in Phoenix with a metal roof

 FireRock Building Materials
Herringbone patterned clay pavers by FireRock
Example of a trendy patio design in Birmingham
Example of a trendy patio design in Birmingham

 Cure Design Group
This coastal glam dining room is bright and clean. Featuring espresso wood dining table, upholstered host and hostess chairs in a gray and white color palette. Accents of navy, mind and yellow. Mercury glass chandelier and over sized sconces fill the space.



 Cypress Homes, Inc.
This spacious kitchen includes various amenities that homeowners desire. The unique tile backsplash makes the walls stand out from the cabinet units. Granite counters and stainless steel appliances are two features in this space.

 Anjie Cho Architect PLLC
This project was a full bathroom renovation in an Upper East Side apartment in New York City.
Inspiration for a small modern master gray tile and marble tile porcelain tile and gray floor alcove shower remodel in New York with white walls, flat-panel cabinets, white cabinets, a one-piece toilet, an undermount sink and quartz countertops
Inspiration for a small modern master gray tile and marble tile porcelain tile and gray floor alcove shower remodel in New York with white walls, flat-panel cabinets, white cabinets, a one-piece toilet, an undermount sink and quartz countertops


 Simmons and Company
Full height stone walls with side wall drain,
Tom Simmons
Trendy bathroom photo in Santa Barbara
Trendy bathroom photo in Santa Barbara

 CustomBuilt-ins.com / CFM Design Inc.
Inspiration for a large transitional u-shaped dark wood floor kitchen pantry remodel in Orange County with recessed-panel cabinets, white cabinets and solid surface countertops
 Ross Howard Designs
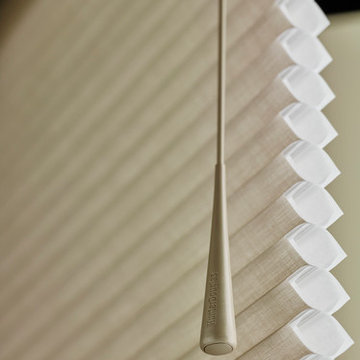
Hunter Douglas | Duette®
Duette®
The original single- and double-honeycomb Duette® shades come in multiple cell sizes, a horizontal or Vertiglide™ vertical orientation, and a range of light-control options from sheer to opaque.
Energy Efficiency
COOL IN THE SUMMER, WARM IN THE WINTER
Did you know that up to 50% of a home’s heating and cooling energy can be lost through its windows? That’s why we designed this unique cellular shade that traps air in distinct pockets to help keep your house cool in the summer and warm in the winter.
And while the honeycomb design is praised for its efficiency, its shape and overall aesthetic are nothing short of beautiful.
Double Honeycomb
EVEN GREATER EFFICIENCIES
Our double-honeycomb construction traps air even more efficiently than our single honeycomb by sandwiching two honeycomb cells between your room and the window.
Absorb Sound
REDUCE OUTSIDE NOISE
Improve your room’s acoustics while reducing the intensity of outside sound. It starts at the windows.
The degree of sound control will depend on the fabric you choose, so if this is an important feature to you, be sure to discuss it with your sales expert.
Top-Down/Bottom-Up
PRIVACY WITH A VIEW
The Top-Down/Bottom-Up feature offers a more versatile approach to light control. Open from the top, from the bottom, or find somewhere in-between–for the perfect balance of privacy and light.
Energy Efficiency
COOL IN THE SUMMER, WARM IN THE WINTER
Did you know that up to 50% of a home’s heating and cooling energy can be lost through its windows? That’s why we designed this unique cellular shade that traps air in distinct pockets to help keep your house cool in the summer and warm in the winter.
And while the honeycomb design is praised for its efficiency, its shape and overall aesthetic are nothing short of beautiful.
Double Honeycomb
EVEN GREATER EFFICIENCIES
Our double-honeycomb construction traps air even more efficiently than our single honeycomb by sandwiching two honeycomb cells between your room and the window.
Absorb Sound
REDUCE OUTSIDE NOISE
Improve your room’s acoustics while reducing the intensity of outside sound. It starts at the windows.
The degree of sound control will depend on the fabric you choose, so if this is an important feature to you, be sure to discuss it with your sales expert.
Vertiglide™
FOR LARGE WINDOWS AND SLIDING DOORS
Vertiglide™ offers an exceptional, energy-efficient vertical solution for large expanses of windows and sliding glass doors.
Top-Down/Bottom-Up
PRIVACY WITH A VIEW
The Top-Down/Bottom-Up feature offers a more versatile approach to light control. Open from the top, from the bottom, or find somewhere in-between–for the perfect balance of privacy and light.
UV protection
SUNSCREEN FOR YOUR VALUABLES
Protect your furniture, flooring and artwork from fading with at least 75% protection from harmful UV rays

 Blue Grouse Wine Cellars
This under stairs wine cellar featured stained and lacquered racking and an insulated glass front wall for maximum visibility of bottles.
Photo Credit: Sebastian Burzynski


52