
Search results for "Confusion" in Home Design Ideas
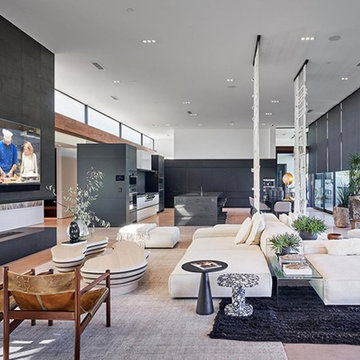
 Electronic Design & Consulting, Inc.
This article is posted here with the consent of the author. The views and opinions expressed in this article are those of the author and do not necessarily reflect the official policy, position, view, or opinion of Crestron Electronics, Inc., or of any of its employees. Crestron Electronics is not responsible for, and does not verify the accuracy of, any of the information contained in this article.
By Jeff Singer
The “smart” revolution began several years ago with smartphones (a.k.a phones) and has extended in recent years to thermostats, doorbells, alarm systems, and kitchen appliances. Smart devices are so ubiquitous that the term “smart” is overused to the point that it is almost meaningless. Companies are eager to jump on the bandwagon and claim their products are “smart,” and consumers proudly claim they have a smart home because they have lighting control. Misconceptions about smart homes are prevalent and create confusion in the marketplace. This can have deleterious effects on businesses and underserve consumers. Here are seven of the most popular misconceptions about smart homes:
1. Apps are smart
Apps are convenient and easy to use. Yes, it seems there’s an app for everything. People expect to be able to download an app and do just about anything. App developers and many companies do not disavow consumers of this myth. On the contrary, they promote this idea with carefully worded descriptions. The promise of having the world at your fingertips for $1.99 is very enticing. Although it sounds too good to be true, it is also too good to pass up for many people. This leads to undervaluing home control and disappointment when the apps don’t work, which undermines confidence in our industry. The fact is that apps are not smart. They do not control anything. They must connect to and communicate with a control system or cloud service that processes, prioritizes, and executes commands. That’s the real magic and what most people do not understand.
2. Smart devices work together
With so many smart appliances and devices on the market today, it’s understandable that the average consumer might think that they actually communicate and work together. This is simply not the case. Smart devices are not that smart. They are designed and manufactured by different, often competing, companies. There are no national or industry standards governing these products. Even if they all operate using Wi-Fi® communications, that doesn’t mean they work together. Some companies promote a home control platform, which unites different devices from different companies – in theory. The platform is yet another third-party software totally dependent on other companies developing APIs and writing control modules for their hardware to run on that piece of software. The devices are not independently compatible. Also, when updates are made to either the hardware or the software, functionality may be affected for some period. That’s a nice way of saying the device or system won’t work and there’s no way of knowing for how long.
3. It’s a DIY project
Which brings us to the next myth, which is that the average person can do it themselves. Unless you are a skilled professional, I would not advise taking on a smart home project. You want to make a light turn on and off with your Alexa® or Google Assistant™ virtual assistant software, go for it. A smart home takes much more planning and expertise. I have no problem changing a light bulb or hanging a light fixture in my dining room; however, I am not going to rewire my house. I may change the flush valve in my toilet, but I’m not going to replace the pipes in my house. You get it. Integrating devices and systems, establishing different zones, creating scenes, designing the UI with a balance between control, feedback, and simplicity – all takes experience and skill.
4. Need a programmer to make changes
Early adopters may have experienced the pain of trying to make a simple change or update to their home control system. Years ago, if the cable provider changed the channel line-up, the homeowner would have to call the dealer or programmer to make an appointment for them to come out to the house to reprogram the system. The system wouldn’t work as expected until it was updated, which often took several days and beaucoup bucks. Not anymore. Technology has evolved so now it’s easy for system owners to change favorite channels, create scenes, rename buttons, update images, and more. While a professional is needed for the initial installation and setup, the system is easy to manage once it’s up and running. This makes life so much easier for both dealer and customer.
5. Tech becomes obsolete quickly
Similar to updating the UI, updating firmware or hardware used to be a stressful process. A smart home should be intelligent enough to update itself. Apps don’t become obsolete. Updates are constantly pushed out from the cloud, making them better all the time. The same is true for a good smart home system. New features, functions, and device support gets added in the background consistently, so the system you installed (or purchased) yesterday gets better over time. Swapping out decorative elements, such as keypads, dimmers, and touch screens is also seamless. When a new device is added, all the settings are pulled down from the cloud and it just works. No system interruptions. No sunk costs. No imposing house calls. No surprise bills.
6. Lighting control saves energy and money
Lighting control is one of the most popular smart systems, but it takes more than just one system to make a home smart. On the surface, it makes sense that if you dim the lights ten percent, then you save ten percent of energy costs. If the shades are raised during the day to take advantage of sunlight so the lights don’t need to be on (or at least not 100%), but that causes the room temperature to rise a few degrees, which triggers the air conditioner to run longer and more often, was energy usage (or cost) reduced? A smart home integrates all the various systems and technology to optimize comfort, convenience, safety, and sometimes energy.
7. Home technology is easy to hack
Security is at the forefront of people’s minds these days. Personal identities are stolen; email accounts hacked; private photos publicized; and more. A smart home must outsmart those who don’t respect privacy. Crestron control systems adhere to the strictest security standards. The same Crestron control system that goes into a home is also installed in secure government and military facilities, global banking institutions, hospitals, and other mission critical applications. When installed correctly by a trained professional, a Crestron smart home is the gold standard for security, comfort, and convenience.

 Build It Right Remodeling
Tile is 6" x 24" Running Bond Lay
Berkshire Hickory with Summer Wheat Grout Color
Inspiration for a mid-sized coastal bathroom remodel in Milwaukee
Inspiration for a mid-sized coastal bathroom remodel in Milwaukee


Find the right local pro for your project


 Renovisions
The owners of this 1980’s built-home wanted to create a completely new look for their outdated master bath and turned to Renovisions for design and build services. Having perused Renovisions website, they were confident they made the right choice to help them transform their ordinary space into something truly extraordinary. The design team created several configurations for the homeowners review until they nailed down one particular design that would create that wow factor.
The main challenges were creating an open, spacious feel and maximizing natural light and ventilation with plenty of storage and customizations. The addition of a second window allows ample light into the space throughout the day along with the recessed and sconce lights which were perfectly placed. Storage, which was a key element of this design, includes two separate vanity cabinets (his and hers) with plenty of space for needed toiletries, a matching framed medicine cabinet for her and a custom built cubby for him. Built on site was a linen closet with both roll out and stationary shelves for towels and shower supplies. The spacious walk-in, all tiled shower boasts ‘no door’ access with lineal drain, traditional fixed and hand-held shower heads and a rounded shower seat. Polished black granite was used inside the cubby and topping both the threshold and seat creating a nice contrast to and tying in with the floor. The decorative grab bar ensures safety for these homeowners while showering. The heated floors added throughout the bath take the edge off when stepping out of the warm shower and are conveniently operated by a 24 hour programmable thermostat. Classic white subway tile and chair rail trims adorne all walls and tie in nicely to each vanity station. Carrera look quartz was the perfect choice for countertops creating a clean fresh look. Stunning marble basket-weave mosaic floor tile set the stage in this exquisite bath as the beautiful white painted cabinetry softened the overall feel of the space.
These homeowners are not saving spa retreats for once-a-year vacations anymore, they now enjoy a relaxing spa-like shower experience every day in their own home!

 Tile Trends, Inc.
Subway Tile-Herringbone
Inspiration for a mid-sized rustic l-shaped dark wood floor and brown floor eat-in kitchen remodel with a farmhouse sink, raised-panel cabinets, dark wood cabinets, quartz countertops, white backsplash, subway tile backsplash, stainless steel appliances, an island and beige countertops
Inspiration for a mid-sized rustic l-shaped dark wood floor and brown floor eat-in kitchen remodel with a farmhouse sink, raised-panel cabinets, dark wood cabinets, quartz countertops, white backsplash, subway tile backsplash, stainless steel appliances, an island and beige countertops



 Barkman Concrete Ltd.
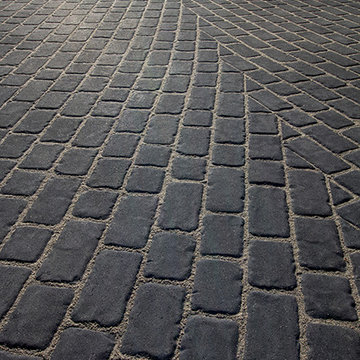
The old-world look of a cobble stone patio, walkway, or driveway is the perfect choice to compliment architecture with old European or early American style. Cobble stone paver has a open spacer joint design, making it ideal for use in permeable paver applications. Photo: Barkman Concrete Ltd.


 Mark Mobley Architecture
Mid-sized arts and crafts front porch idea in Baltimore with decking and a roof extension

 JM Carpets
Example of a mid-sized transitional 3/4 mosaic tile floor bathroom design in Milwaukee with shaker cabinets, white cabinets and yellow walls


 Atlanta Decking & Fence Co., Inc.
Project designed and built by Atlanta Decking & Fence.
Elegant spiral staircase photo in Atlanta
Elegant spiral staircase photo in Atlanta

 First State Building & Design
We expanded an existing deck with new stairs, railing, decking, deck board design, lighting, complete with all post and beam wraps. All decking you see is Zuri decking with Timbertech Rail Systems. We installed riser lights up the stairs with post caps on top of all posts.


 Stonebridge Mosaics
A unique pattern of Thassos and Mother of Pearl in a brilliant shade of icy blue!
Example of a minimalist kitchen design in New York with blue backsplash and mosaic tile backsplash
Example of a minimalist kitchen design in New York with blue backsplash and mosaic tile backsplash

 safe ZOnea
If you’re active on GardenWeb sharing plant photos, asking for advice, tracking seasonal progress you already understand how much detail goes into gardening. Soil pH, rainfall, emerging leaves, bloom counts, fertilizer schedules it adds up fast. But all that rich information often remains buried in posts, lists or memory. What if you could visualize that data and turn it into clear quick insights? That’s where a graph maker becomes a game-changer for your gardening workflow.
1. Why garden data belongs on a graph
On GardenWeb, you’ll find forums for everything from perennial care, vegetable gardening, patios, herbs, even cooking and craft projects. While plant lovers share observations and ask questions, many track progress manually in spreadsheets or memory. A graph maker flips that around:
Instead of a list of numbers (e.g., “Soil test: pH 6.4 in May, 6.1 in October”), you get a line graph showing the decline over time.
Instead of guessing which plant bloomed most, you see a bar chart comparing counts across plants.
Instead of manually calculating average rainfall effect, you plot scatter points of bloom count vs. rainfall.
By turning your data into visuals, you’re not just recording—you’re analysing, learning and improving. For GardenWeb users this means smarter decisions: Which fertilizer actually improves bloom count? Which shady spot recovers slower? A graph maker gives clarity.
2. What is a graph maker and how to use one
A graph maker is a web tool or software that lets you input raw data (numbers, dates, categories) and output visual charts like line graphs, bar charts, scatter plots, etc. It might allow you to import a spreadsheet, select chart type, customize colours, label axes, and export the image for your blog, forum post or personal log.
Here’s how you could apply it for gardening:
Log blooms per week for each rose plant.
Using the graph maker, choose line graph to track changes over weeks.
Label your y-axis “Number of Blooms”, x-axis “Week of Year”.
Add colour lines for each plant for easy comparison.
Export as PNG and embed it in a GardenWeb forum post: “See bloom trend for my ‘Peace’ vs ‘Knock Out’ roses”.
This isn’t just pretty-to-look-at: it makes the trend obvious, invites discussion (“Hey, your ‘Knock Out’ line dips after week 28—what changed?”) and helps you refine your routine.
3. Use these specific scenarios on GardenWeb
A. Soil pH and plant health tracking
After multiple tests you have pH values over time and bloom results. Upload both datasets into the graph maker, produce a dual-axis line graph: soil pH on one axis, bloom count on the other. Post your findings in the “Soil, Fertility & Nutrients” forum and get feedback.
B. Seasonal pest or disease appearance
Record number of aphids spotted each month and whether you used treatment. A bar chart via the graph maker can show pre- and post-treatment figures. Then ask the “Insect & Disease Control” forum for advice based on your visual data.
C. Yield comparison between varieties
You grow two zucchini varieties. You keep weekly yield in pounds. Use the graph maker for a side-by-side bar chart. Share in the “Vegetable Gardening” forum: “Which was better this year? See the chart”.
D. Rainfall vs growth rate
You log weekly rainfall and growth (in cm) of your tomato plants. Use scatter plot in graph maker. If a pattern emerges, you’re ready to post: “Is my growth plateau due to drought? Chart shows a clear correlation.”
4. Why this elevates your GardenWeb contributions
When you post with a chart made by a graph maker, you’re doing more than asking or showing off. You’re investigating. You’re analysing. You invite the community to give feedback on data, not just anecdotes. That elevates the discussion. Instead of “My plant died, any ideas?” you post “See this graph of pH drop and bloom count—what might be the limiting factor?” High-quality visuals raise your post’s value and garner more thoughtful responses.
Plus, your posts become useful references for others: someone else can say, “Cool graphic, can you share your data sheet?” You build credibility and help the forum become a learning hub—not just a Q&A board.
5. Tips for using a graph maker effectively in the GardenWeb context
Keep it simple: One chart, one insight. Don’t overcrowd.
Label clearly: Titles, axis labels, units (e.g., cm/week, mg/L, °F).
Use readable colours: Avoid faint tones that vanish on mobile.
Annotate when needed: Add notes like “Fertiliser switched week 12” or “Shade cloth added”.
Provide context in your post: Don’t leave the chart alone—write a few sentences explaining what it shows and what you’re seeking.
Embed carefully: Make sure your image displays properly in GardenWeb; check mobile view.
Share raw data: If possible link to your spreadsheet so others can replicate or comment.
Be open to feedback: The chart invites questions; embrace them.
6. Possible pitfalls and how to avoid them
Bad data = bad chart: If your measurements aren’t consistent, your graph will mislead. Use standardized data collection.
Too much complexity: Multi-axis charts, too many variables—confusing. Stick to one or two variables.
Overlooking mobile viewers: Many GardenWeb users browse via phones. Use large fonts and simple visuals.
Ignoring the narrative: Chart alone won’t answer. Explain what it means and what you need.
Outdated charts: If you update your data annually, keep your visuals current or label them clearly as “2024 data”.
7. Final thoughts
On GardenWeb you’ll find a vibrant community of gardeners, DIYers, cooks and design lovers.Using a graph maker for your posts and progress turns your experience from casual hobby-logging into smart data-driven gardening. You’ll not only learn more—your peers will learn more, too.
So next time you log your plant growth, record your yield, test your soil or track pests—don’t just note it. Plot it. Use a graph maker. Share it in the forum. Let your garden tell the story, and let the community help you write the next chapter.

 Main Street Floor & Shade
Masland Tristan stair runner fabricated in New Rochelle
Example of a classic staircase design in New York
Example of a classic staircase design in New York

 Smart Construction Inc.
The Tanglewood is a Donald A. Gardner plan with three bedrooms and two bathrooms. This 2,500 square foot home is near completion and custom built in Grey Fox Forest in Shelby, NC. Like the Smart Construction, Inc. Facebook page or follow us on Instagram at scihomes.dream.build.live to follow the progress of other Craftsman Style homes. DREAM. BUILD. LIVE. www.smartconstructionhomes.com
43