
Search results for "Data based startups" in Home Design Ideas

 True Carpentry and Cabinetry
Largely designed by the homeowners, with adjustments by me for functionality and appearance, this home office built-in features a large hidden storage capacity with 18" deep doored upper cabinets. It also has a visible pencil drawer in the desk section, and four pullouts in the base units that are all custom sized for specific purposes, and include a letter-size file drawer. There are even doors covering a 3" deep space underneath the desk area to cover up the electrical and data cables. Existing crown molding is run across the top to tie it in visually with the room. There is vertical "fluted" trim, but without the flutes.
 True Carpentry and Cabinetry
Largely designed by the homeowners, with adjustments by me for functionality and appearance, this home office built-in features a large hidden storage capacity with 18" deep doored upper cabinets. It also has a visible pencil drawer in the desk section, and four pullouts in the base units that are all custom sized for specific purposes, and include a letter-size file drawer. There are even doors covering a 3" deep space underneath the desk area to cover up the electrical and data cables. Existing crown molding is run across the top to tie it in visually with the room. There is vertical "fluted" trim, but without the flutes.
 True Carpentry and Cabinetry
Largely designed by the homeowners, with adjustments by me for functionality and appearance, this home office built-in features a large hidden storage capacity with 18" deep doored upper cabinets. It also has a visible pencil drawer in the desk section, and four pullouts in the base units that are all custom sized for specific purposes, and include a letter-size file drawer. There are even doors covering a 3" deep space underneath the desk area to cover up the electrical and data cables. Existing crown molding is run across the top to tie it in visually with the room. There is vertical "fluted" trim, but without the flutes.
Find the right local pro for your project
 Lightspeed Electrical
Electrical fit-out in Baulkham Hills, north-west Sydney
Client: Lifestyle Solutions
Location: 62 Norwest Blvd, Baulkham Hills, NSW (2153)
Scope of Work: Full strip-out and fit-out of a 130-workstation office
Lifestyle Solutions were handed a tenancy meant to be a back-to-base shell. It wasn’t. Most of the old infrastructure was still in, half the required lighting was missing, and they’d already signed an as-is lease. They called the commercial electrician Sydney tenants ring when a handover goes wrong.
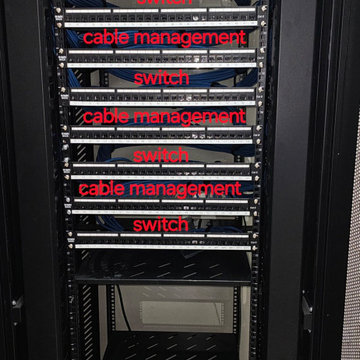
We stripped out the old services, then built it back properly: Dynalite automation controls, LED panels and downlights, over 250 structured data points, power to 130 workstations, floor boxes at the meeting tables, video conferencing in the meeting rooms, Cat6a to the WiFi outlets, and an emergency lighting upgrade. Old fluorescents removed and recycled, all fitted around the builder’s schedule.
An as-is lease makes the tenancy’s condition your problem. Worth an electrical inspection before you sign.
Lifestyle Solutions, thank you for the trust on a job that started from a tough position.
Services: Commercial Electrician Sydney | Electrical Office Fitouts | Data Cabling | LED Installation | Switchboard Upgrades
 True Carpentry and Cabinetry
Largely designed by the homeowners, with adjustments by me for functionality and appearance, this home office built-in features a large hidden storage capacity with 18" deep doored upper cabinets. It also has a visible pencil drawer in the desk section, and four pullouts in the base units that are all custom sized for specific purposes, and include a letter-size file drawer. There are even doors covering a 3" deep space underneath the desk area to cover up the electrical and data cables. Existing crown molding is run across the top to tie it in visually with the room. There is vertical "fluted" trim, but without the flutes.
 True Carpentry and Cabinetry
Largely designed by the homeowners, with adjustments by me for functionality and appearance, this home office built-in features a large hidden storage capacity with 18" deep doored upper cabinets. It also has a visible pencil drawer in the desk section, and four pullouts in the base units that are all custom sized for specific purposes, and include a letter-size file drawer. There are even doors covering a 3" deep space underneath the desk area to cover up the electrical and data cables. Existing crown molding is run across the top to tie it in visually with the room. There is vertical "fluted" trim, but without the flutes.
 True Carpentry and Cabinetry
Largely designed by the homeowners, with adjustments by me for functionality and appearance, this home office built-in features a large hidden storage capacity with 18" deep doored upper cabinets. It also has a visible pencil drawer in the desk section, and four pullouts in the base units that are all custom sized for specific purposes, and include a letter-size file drawer. There are even doors covering a 3" deep space underneath the desk area to cover up the electrical and data cables. Existing crown molding is run across the top to tie it in visually with the room. There is vertical "fluted" trim, but without the flutes.

 Lightspeed Electrical
Electrical fit-out in Baulkham Hills, north-west Sydney
Client: Lifestyle Solutions
Location: 62 Norwest Blvd, Baulkham Hills, NSW (2153)
Scope of Work: Full strip-out and fit-out of a 130-workstation office
Lifestyle Solutions were handed a tenancy meant to be a back-to-base shell. It wasn’t. Most of the old infrastructure was still in, half the required lighting was missing, and they’d already signed an as-is lease. They called the commercial electrician Sydney tenants ring when a handover goes wrong.
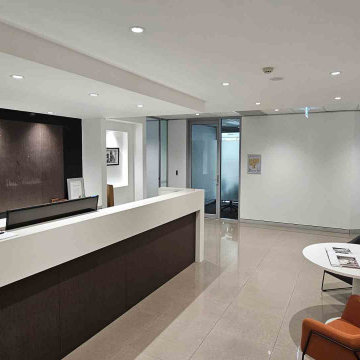
We stripped out the old services, then built it back properly: Dynalite automation controls, LED panels and downlights, over 250 structured data points, power to 130 workstations, floor boxes at the meeting tables, video conferencing in the meeting rooms, Cat6a to the WiFi outlets, and an emergency lighting upgrade. Old fluorescents removed and recycled, all fitted around the builder’s schedule.
An as-is lease makes the tenancy’s condition your problem. Worth an electrical inspection before you sign.
Lifestyle Solutions, thank you for the trust on a job that started from a tough position.
Services: Commercial Electrician Sydney | Electrical Office Fitouts | Data Cabling | LED Installation | Switchboard Upgrades

 Wike LaFrey
The area off the kitchen becomes the dedicated homework area for the family's two children. This allows the family to stay connected during their busy evenings.



 The Lead Market
Looking for expert lead generation in USA? Our proven strategies help businesses connect with high-quality prospects and close more deals. As a MSP lead generation company, the Lead Market specialize in identifying and nurturing leads that drive revenue. Whether you need MSP qualified leads or high-value corporate clients, our data-driven approach ensures your pipeline is filled with decision-makers ready to engage. With our targeted methods, you can maximize ROI and accelerate growth. Don’t waste time on low-quality leads—partner with us and watch your business scale effortlessly. Contact us today to enhance your B2B managed services sales efforts.


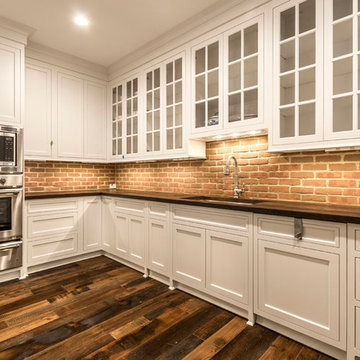


 Interiology Design Co.
James R. Salomon Photography.
Inspiration for a transitional medium tone wood floor kitchen remodel in Boston with shaker cabinets, dark wood cabinets and white backsplash
Inspiration for a transitional medium tone wood floor kitchen remodel in Boston with shaker cabinets, dark wood cabinets and white backsplash

 Gam Woodwork
Custom TV Unit
Finish: Dark grey (silver sparkly) high gloss
Bottom Cabinet:
Finish: white painted high gloss
Stip LED light around cabinet
Inspiration for a mid-sized contemporary open concept gray floor family room remodel in Miami with white walls, a wall-mounted tv and no fireplace
Inspiration for a mid-sized contemporary open concept gray floor family room remodel in Miami with white walls, a wall-mounted tv and no fireplace
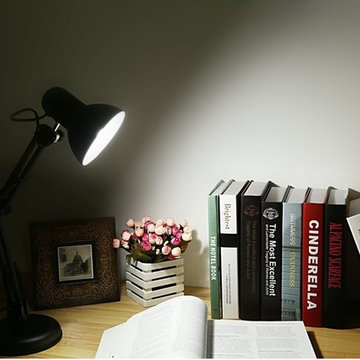
 Lighting EVER
Quite a bit of flexibility
No longer need to move your books or notebooks around to get it in the light at night.
The spring loaded arm makes it easy to swing up and down smoothly, and the head of the lamp also turns around freely.
Versatile
Handy lamp, fits in a number of areas. You can clip it to many places with the C-clamp included.
Say, clamp it on a shelf, chair, bedrail, bench, or any other places you would like to.
With the heavy weighted base, the lamp can also stand on its own without tripping over.
Replaceable bulbs
With an E26 sized screw base, the bulb can be replaced as desired.
The fuse maximum permissible wattage is 100W, and a 40W bulb is bright enough for normal use.
Instant On
The lamp response instantly, there is no waiting for light to appear.
Delicate size
The elegant body of the lamp provides a beautiful and exquisite style that perfectly suitable for you.
It comes with a C-clamp for space saving.
The cord of the adapter is long enough to reach the outlet.
The clamp is screw-on-type rather than a tension-type, which avoid of leaving bite marks on the desk.
Key Data
Brand: Lighting EVER/LE; Item weight: 3 pounds; Shell Color: Black; Finish: Painting; Power source: Corded-Electric;
Input Voltage:110-130V; Base Diameter: 6.02inches; Length of the power cord: 59.06inches.

 safe ZOnea
If you’re active on GardenWeb sharing plant photos, asking for advice, tracking seasonal progress you already understand how much detail goes into gardening. Soil pH, rainfall, emerging leaves, bloom counts, fertilizer schedules it adds up fast. But all that rich information often remains buried in posts, lists or memory. What if you could visualize that data and turn it into clear quick insights? That’s where a graph maker becomes a game-changer for your gardening workflow.
1. Why garden data belongs on a graph
On GardenWeb, you’ll find forums for everything from perennial care, vegetable gardening, patios, herbs, even cooking and craft projects. While plant lovers share observations and ask questions, many track progress manually in spreadsheets or memory. A graph maker flips that around:
Instead of a list of numbers (e.g., “Soil test: pH 6.4 in May, 6.1 in October”), you get a line graph showing the decline over time.
Instead of guessing which plant bloomed most, you see a bar chart comparing counts across plants.
Instead of manually calculating average rainfall effect, you plot scatter points of bloom count vs. rainfall.
By turning your data into visuals, you’re not just recording—you’re analysing, learning and improving. For GardenWeb users this means smarter decisions: Which fertilizer actually improves bloom count? Which shady spot recovers slower? A graph maker gives clarity.
2. What is a graph maker and how to use one
A graph maker is a web tool or software that lets you input raw data (numbers, dates, categories) and output visual charts like line graphs, bar charts, scatter plots, etc. It might allow you to import a spreadsheet, select chart type, customize colours, label axes, and export the image for your blog, forum post or personal log.
Here’s how you could apply it for gardening:
Log blooms per week for each rose plant.
Using the graph maker, choose line graph to track changes over weeks.
Label your y-axis “Number of Blooms”, x-axis “Week of Year”.
Add colour lines for each plant for easy comparison.
Export as PNG and embed it in a GardenWeb forum post: “See bloom trend for my ‘Peace’ vs ‘Knock Out’ roses”.
This isn’t just pretty-to-look-at: it makes the trend obvious, invites discussion (“Hey, your ‘Knock Out’ line dips after week 28—what changed?”) and helps you refine your routine.
3. Use these specific scenarios on GardenWeb
A. Soil pH and plant health tracking
After multiple tests you have pH values over time and bloom results. Upload both datasets into the graph maker, produce a dual-axis line graph: soil pH on one axis, bloom count on the other. Post your findings in the “Soil, Fertility & Nutrients” forum and get feedback.
B. Seasonal pest or disease appearance
Record number of aphids spotted each month and whether you used treatment. A bar chart via the graph maker can show pre- and post-treatment figures. Then ask the “Insect & Disease Control” forum for advice based on your visual data.
C. Yield comparison between varieties
You grow two zucchini varieties. You keep weekly yield in pounds. Use the graph maker for a side-by-side bar chart. Share in the “Vegetable Gardening” forum: “Which was better this year? See the chart”.
D. Rainfall vs growth rate
You log weekly rainfall and growth (in cm) of your tomato plants. Use scatter plot in graph maker. If a pattern emerges, you’re ready to post: “Is my growth plateau due to drought? Chart shows a clear correlation.”
4. Why this elevates your GardenWeb contributions
When you post with a chart made by a graph maker, you’re doing more than asking or showing off. You’re investigating. You’re analysing. You invite the community to give feedback on data, not just anecdotes. That elevates the discussion. Instead of “My plant died, any ideas?” you post “See this graph of pH drop and bloom count—what might be the limiting factor?” High-quality visuals raise your post’s value and garner more thoughtful responses.
Plus, your posts become useful references for others: someone else can say, “Cool graphic, can you share your data sheet?” You build credibility and help the forum become a learning hub—not just a Q&A board.
5. Tips for using a graph maker effectively in the GardenWeb context
Keep it simple: One chart, one insight. Don’t overcrowd.
Label clearly: Titles, axis labels, units (e.g., cm/week, mg/L, °F).
Use readable colours: Avoid faint tones that vanish on mobile.
Annotate when needed: Add notes like “Fertiliser switched week 12” or “Shade cloth added”.
Provide context in your post: Don’t leave the chart alone—write a few sentences explaining what it shows and what you’re seeking.
Embed carefully: Make sure your image displays properly in GardenWeb; check mobile view.
Share raw data: If possible link to your spreadsheet so others can replicate or comment.
Be open to feedback: The chart invites questions; embrace them.
6. Possible pitfalls and how to avoid them
Bad data = bad chart: If your measurements aren’t consistent, your graph will mislead. Use standardized data collection.
Too much complexity: Multi-axis charts, too many variables—confusing. Stick to one or two variables.
Overlooking mobile viewers: Many GardenWeb users browse via phones. Use large fonts and simple visuals.
Ignoring the narrative: Chart alone won’t answer. Explain what it means and what you need.
Outdated charts: If you update your data annually, keep your visuals current or label them clearly as “2024 data”.
7. Final thoughts
On GardenWeb you’ll find a vibrant community of gardeners, DIYers, cooks and design lovers.Using a graph maker for your posts and progress turns your experience from casual hobby-logging into smart data-driven gardening. You’ll not only learn more—your peers will learn more, too.
So next time you log your plant growth, record your yield, test your soil or track pests—don’t just note it. Plot it. Use a graph maker. Share it in the forum. Let your garden tell the story, and let the community help you write the next chapter.

 Keilty Remodeling LLC
Chris Keilty
Example of a mid-sized classic master gray tile and ceramic tile ceramic tile drop-in bathtub design in Boise with an undermount sink, shaker cabinets, medium tone wood cabinets, granite countertops, a two-piece toilet and beige walls
Example of a mid-sized classic master gray tile and ceramic tile ceramic tile drop-in bathtub design in Boise with an undermount sink, shaker cabinets, medium tone wood cabinets, granite countertops, a two-piece toilet and beige walls
2