
Search results for "Data driven audit" in Home Design Ideas


 Bolster
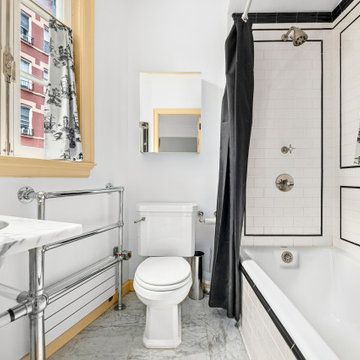
Renovation of a West Village townhouse bathroom by Bolster, a data-driven design-build firm in NYC.
Example of a small classic master black and white tile and ceramic tile marble floor, gray floor and single-sink alcove bathtub design in New York with open cabinets, a one-piece toilet, white walls, a pedestal sink, marble countertops, gray countertops and a freestanding vanity
Example of a small classic master black and white tile and ceramic tile marble floor, gray floor and single-sink alcove bathtub design in New York with open cabinets, a one-piece toilet, white walls, a pedestal sink, marble countertops, gray countertops and a freestanding vanity
 Bolster
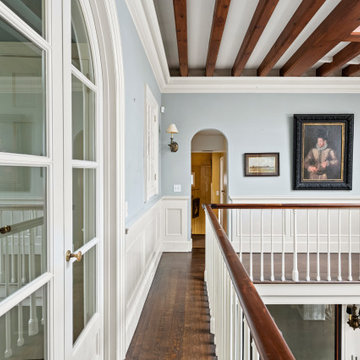
Renovation of a West Village townhouse by Bolster, a data-driven design-build firm in NYC.
Example of a large classic dark wood floor, brown floor, exposed beam and wainscoting hallway design in New York with blue walls
Example of a large classic dark wood floor, brown floor, exposed beam and wainscoting hallway design in New York with blue walls
Find the right local pro for your project
 Bolster
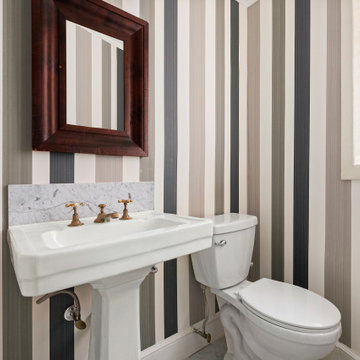
Renovation of a West Village powder room by Bolster, a data-driven design-build firm in NYC.
Example of a small classic multicolored tile ceramic tile, gray floor, exposed beam and wallpaper powder room design in New York with white cabinets, a one-piece toilet, multicolored walls, a pedestal sink, marble countertops, white countertops and a freestanding vanity
Example of a small classic multicolored tile ceramic tile, gray floor, exposed beam and wallpaper powder room design in New York with white cabinets, a one-piece toilet, multicolored walls, a pedestal sink, marble countertops, white countertops and a freestanding vanity
 Bolster
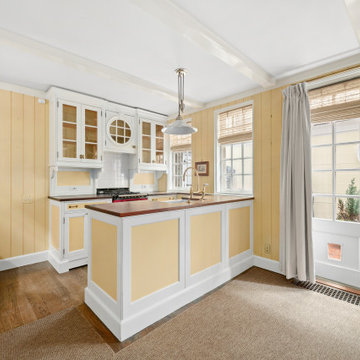
Renovation of a West Village kitchen by Bolster, a data-driven design-build firm in NYC.
Example of a small classic galley dark wood floor, brown floor and exposed beam eat-in kitchen design in New York with a farmhouse sink, glass-front cabinets, white cabinets, wood countertops, stainless steel appliances, a peninsula and brown countertops
Example of a small classic galley dark wood floor, brown floor and exposed beam eat-in kitchen design in New York with a farmhouse sink, glass-front cabinets, white cabinets, wood countertops, stainless steel appliances, a peninsula and brown countertops


 Bolster
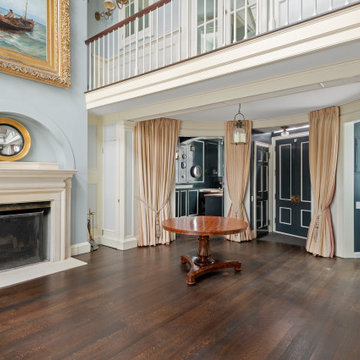
Renovation of a West Village living room by Bolster, a data-driven design-build firm in NYC.
Large elegant formal and open concept dark wood floor, brown floor, exposed beam and wainscoting living room photo in New York with blue walls, a standard fireplace, a concrete fireplace and no tv
Large elegant formal and open concept dark wood floor, brown floor, exposed beam and wainscoting living room photo in New York with blue walls, a standard fireplace, a concrete fireplace and no tv
 Bolster
Major gut renovation of an Upper West Side living room by Bolster, NYC's most data-driven design-build firm.
Inspiration for a large contemporary enclosed light wood floor and beige floor living room remodel in New York with white walls, no fireplace and a wall-mounted tv
Inspiration for a large contemporary enclosed light wood floor and beige floor living room remodel in New York with white walls, no fireplace and a wall-mounted tv
 Bolster
Major gut renovation of an Upper West Side living room by Bolster, NYC's most data-driven design-build firm.
Example of a large trendy enclosed light wood floor and beige floor living room design in New York with white walls, no fireplace and a wall-mounted tv
Example of a large trendy enclosed light wood floor and beige floor living room design in New York with white walls, no fireplace and a wall-mounted tv
 Bolster
Major gut renovation of an Upper West Side primary bedroom by Bolster, NYC's most data-driven design-build firm.
Bedroom - mid-sized contemporary master light wood floor and beige floor bedroom idea in New York with white walls and no fireplace
Bedroom - mid-sized contemporary master light wood floor and beige floor bedroom idea in New York with white walls and no fireplace

 avenue design inc
Inspiration for a large contemporary light wood floor, beige floor and wallpaper enclosed dining room remodel in Toronto with black walls

 FineLine Kitchens, Inc.
Our designer has achieved a stylish look by combining dark cabinets and light-colored marbles.

 The Lead Market
Looking for expert lead generation in USA? Our proven strategies help businesses connect with high-quality prospects and close more deals. As a MSP lead generation company, the Lead Market specialize in identifying and nurturing leads that drive revenue. Whether you need MSP qualified leads or high-value corporate clients, our data-driven approach ensures your pipeline is filled with decision-makers ready to engage. With our targeted methods, you can maximize ROI and accelerate growth. Don’t waste time on low-quality leads—partner with us and watch your business scale effortlessly. Contact us today to enhance your B2B managed services sales efforts.


 Mina Kim
Marvelous Desk
Inspiration for a mid-sized modern freestanding desk light wood floor and beige floor study room remodel in New York with white walls
Inspiration for a mid-sized modern freestanding desk light wood floor and beige floor study room remodel in New York with white walls

 safe ZOnea
If you’re active on GardenWeb sharing plant photos, asking for advice, tracking seasonal progress you already understand how much detail goes into gardening. Soil pH, rainfall, emerging leaves, bloom counts, fertilizer schedules it adds up fast. But all that rich information often remains buried in posts, lists or memory. What if you could visualize that data and turn it into clear quick insights? That’s where a graph maker becomes a game-changer for your gardening workflow.
1. Why garden data belongs on a graph
On GardenWeb, you’ll find forums for everything from perennial care, vegetable gardening, patios, herbs, even cooking and craft projects. While plant lovers share observations and ask questions, many track progress manually in spreadsheets or memory. A graph maker flips that around:
Instead of a list of numbers (e.g., “Soil test: pH 6.4 in May, 6.1 in October”), you get a line graph showing the decline over time.
Instead of guessing which plant bloomed most, you see a bar chart comparing counts across plants.
Instead of manually calculating average rainfall effect, you plot scatter points of bloom count vs. rainfall.
By turning your data into visuals, you’re not just recording—you’re analysing, learning and improving. For GardenWeb users this means smarter decisions: Which fertilizer actually improves bloom count? Which shady spot recovers slower? A graph maker gives clarity.
2. What is a graph maker and how to use one
A graph maker is a web tool or software that lets you input raw data (numbers, dates, categories) and output visual charts like line graphs, bar charts, scatter plots, etc. It might allow you to import a spreadsheet, select chart type, customize colours, label axes, and export the image for your blog, forum post or personal log.
Here’s how you could apply it for gardening:
Log blooms per week for each rose plant.
Using the graph maker, choose line graph to track changes over weeks.
Label your y-axis “Number of Blooms”, x-axis “Week of Year”.
Add colour lines for each plant for easy comparison.
Export as PNG and embed it in a GardenWeb forum post: “See bloom trend for my ‘Peace’ vs ‘Knock Out’ roses”.
This isn’t just pretty-to-look-at: it makes the trend obvious, invites discussion (“Hey, your ‘Knock Out’ line dips after week 28—what changed?”) and helps you refine your routine.
3. Use these specific scenarios on GardenWeb
A. Soil pH and plant health tracking
After multiple tests you have pH values over time and bloom results. Upload both datasets into the graph maker, produce a dual-axis line graph: soil pH on one axis, bloom count on the other. Post your findings in the “Soil, Fertility & Nutrients” forum and get feedback.
B. Seasonal pest or disease appearance
Record number of aphids spotted each month and whether you used treatment. A bar chart via the graph maker can show pre- and post-treatment figures. Then ask the “Insect & Disease Control” forum for advice based on your visual data.
C. Yield comparison between varieties
You grow two zucchini varieties. You keep weekly yield in pounds. Use the graph maker for a side-by-side bar chart. Share in the “Vegetable Gardening” forum: “Which was better this year? See the chart”.
D. Rainfall vs growth rate
You log weekly rainfall and growth (in cm) of your tomato plants. Use scatter plot in graph maker. If a pattern emerges, you’re ready to post: “Is my growth plateau due to drought? Chart shows a clear correlation.”
4. Why this elevates your GardenWeb contributions
When you post with a chart made by a graph maker, you’re doing more than asking or showing off. You’re investigating. You’re analysing. You invite the community to give feedback on data, not just anecdotes. That elevates the discussion. Instead of “My plant died, any ideas?” you post “See this graph of pH drop and bloom count—what might be the limiting factor?” High-quality visuals raise your post’s value and garner more thoughtful responses.
Plus, your posts become useful references for others: someone else can say, “Cool graphic, can you share your data sheet?” You build credibility and help the forum become a learning hub—not just a Q&A board.
5. Tips for using a graph maker effectively in the GardenWeb context
Keep it simple: One chart, one insight. Don’t overcrowd.
Label clearly: Titles, axis labels, units (e.g., cm/week, mg/L, °F).
Use readable colours: Avoid faint tones that vanish on mobile.
Annotate when needed: Add notes like “Fertiliser switched week 12” or “Shade cloth added”.
Provide context in your post: Don’t leave the chart alone—write a few sentences explaining what it shows and what you’re seeking.
Embed carefully: Make sure your image displays properly in GardenWeb; check mobile view.
Share raw data: If possible link to your spreadsheet so others can replicate or comment.
Be open to feedback: The chart invites questions; embrace them.
6. Possible pitfalls and how to avoid them
Bad data = bad chart: If your measurements aren’t consistent, your graph will mislead. Use standardized data collection.
Too much complexity: Multi-axis charts, too many variables—confusing. Stick to one or two variables.
Overlooking mobile viewers: Many GardenWeb users browse via phones. Use large fonts and simple visuals.
Ignoring the narrative: Chart alone won’t answer. Explain what it means and what you need.
Outdated charts: If you update your data annually, keep your visuals current or label them clearly as “2024 data”.
7. Final thoughts
On GardenWeb you’ll find a vibrant community of gardeners, DIYers, cooks and design lovers.Using a graph maker for your posts and progress turns your experience from casual hobby-logging into smart data-driven gardening. You’ll not only learn more—your peers will learn more, too.
So next time you log your plant growth, record your yield, test your soil or track pests—don’t just note it. Plot it. Use a graph maker. Share it in the forum. Let your garden tell the story, and let the community help you write the next chapter.
 Allreno
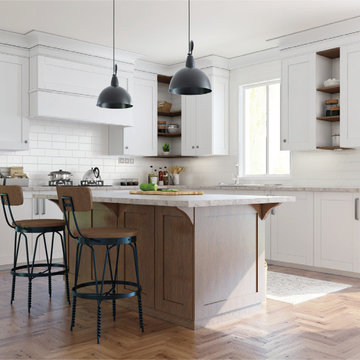
A kitchen renovation is one of the most impactful ways to enhance a home’s value, functionality, and aesthetics. Whether in New York’s compact urban apartments or New Jersey’s spacious suburban homes, homeowners are constantly seeking innovative solutions to optimize their kitchen spaces. The key elements in any renovation are kitchen cabinets, layout efficiency, and design aesthetics. With advancements in technology, artificial intelligence is revolutionizing the industry, making the renovation process faster, smarter, and more cost-effective.
The Role of Kitchen Cabinets in Renovation
Kitchen cabinets serve as the foundation of any kitchen design. They not only provide storage but also define the overall look and feel of the space. From traditional wood finishes to sleek, modern designs, selecting the right cabinets is crucial to achieving both form and function.
In New York, where space is often limited, custom cabinetry solutions that maximize storage without compromising aesthetics are in high demand. Conversely, in New Jersey’s larger homes, homeowners have the flexibility to explore spacious layouts with expansive cabinetry options. The emergence of high-quality, customizable kitchen cabinetry has allowed homeowners to create tailored solutions that fit their lifestyles and design preferences.
Kitchen Design Trends and Innovation
Modern kitchen design is driven by a combination of style, efficiency, and sustainability. Open-concept layouts, handle-free cabinets, and smart storage solutions are gaining popularity among homeowners. Additionally, materials such as quartz countertops, high-gloss finishes, and natural wood elements continue to be top choices for a contemporary aesthetic.
With an increasing focus on sustainability, many homeowners are opting for eco-friendly materials and energy-efficient appliances. Smart kitchens, equipped with IoT-enabled appliances, voice-controlled lighting, and automated temperature control, are also becoming a standard in high-end renovations.
Revolutionizing Kitchen Renovation with AI
AI-powered design solutions are transforming how homeowners plan and execute kitchen renovations. Allreno, a cutting-edge AI-driven renovation platform, is leading the charge in making kitchen remodels more efficient and accessible. With Allreno’s AI design technology, homeowners can visualize their dream kitchens instantly, experiment with different layouts, and receive cost-effective recommendations without the traditional back-and-forth with designers.
This AI-driven approach drastically reduces the time required for planning, ensuring a seamless renovation experience. Homeowners can explore various cabinet styles, finishes, and configurations tailored to their space and budget, ultimately streamlining the decision-making process.
New York and New Jersey: The Perfect Markets for AI-Powered Renovation
New York and New Jersey offer a diverse range of homes, from historic brownstones and luxury penthouses to sprawling suburban residences. Each renovation project comes with its unique challenges, whether it's maximizing storage in a Manhattan apartment or designing a spacious, chef-friendly kitchen in a New Jersey home.
Allreno’s AI technology is particularly beneficial in these markets, where efficiency, precision, and customization are essential. By integrating AI into the renovation process, homeowners can make data-driven decisions, ensuring their new kitchens are not only stylish but also highly functional.
The Future of Kitchen Renovation
As technology continues to evolve, AI-driven platforms like Allreno will play an increasingly significant role in home renovations. By simplifying the design process, offering real-time visualizations, and providing cost-effective solutions, AI is making high-quality kitchen renovations more accessible than ever.
For homeowners in New York and New Jersey looking to renovate their kitchens, embracing AI-driven solutions can lead to a faster, smarter, and more personalized experience. Whether upgrading kitchen cabinets, optimizing layouts, or selecting the perfect design elements, the future of kitchen renovation is here—and it’s powered by AI.
Tags: ai design, bathroom renovation, renovation, bathroom design, interior design
www.allreno.co

 Mittendorf Quality Construction
Inspiration for a rustic brown one-story wood gable roof remodel in Seattle
 harry schott
Running a small restaurant is a high-wire act - delicious plates on one end, razor-thin margins on the other. With food costs averaging 28-35 percent of revenue and labor at 30 percent, every dollar counts. The good news? Targeted tweaks can shave 10-20 percent off your bottom line without sacrificing quality. From smarter sourcing to streamlined waste handling, these strategies empower independents to thrive. One underrated gem: Efficient waste management via roll-off dumpster rentals, which can slash disposal fees by up to 40 percent. Let's break it down.
Optimize Inventory: Waste Less, Save More
Overstocked pantries are profit killers - U.S. restaurants toss $25 billion in food yearly. Audit weekly. Track sales data to forecast demand, using apps like Toast or MarketMan for real-time insights. Trim your menu to 12-15 core items, focusing on seasonal, high-margin stars like farm-fresh salads over imported proteins. Portion control is key - pre-weighed scoops cut overuse by 15 percent.
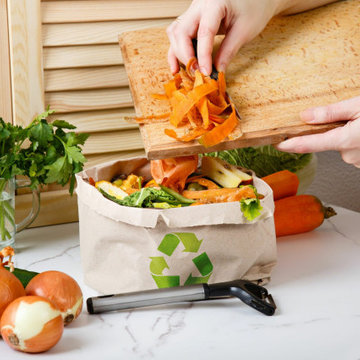
Repurpose scraps creatively. Veggie peels into stocks, bread ends for croutons. Donate extras to food banks via apps like Too Good To Go, earning tax deductions up to $5,000 annually. These habits reclaim 5-10 percent of food budgets, freeing cash for upgrades. Additionally, consider using citrus rinds for infused oils or desserts, and coffee grounds for compost to support local gardens. Engaging staff in sustainability efforts also builds morale and can be highlighted in marketing materials to attract eco-conscious diners.
Trim Energy and Utilities: Go Green for Greenbacks
Utilities gobble 4-10 percent of expenses. Swap to LED bulbs and energy-star appliances - upfront costs pay back in 6-12 months via 20-30 percent bill drops. Install low-flow faucets and programmable thermostats; during off-hours, dial down to 55°F to save $200/month on HVAC.
Use induction cooktops for precise heat, reducing gas by 15 percent. Train staff on "last out" protocols - unplugging idle equipment. Solar panels? For rooftops under 1,000 sq ft, incentives cover 30 percent installation, yielding ROI in 5 years.
Master Waste Management: Dumpsters as Cost Commanders
Trash isn't just garbage - it's a budget black hole, with disposal eating 2-5 percent of revenues. Small spots generate 1-2 tons monthly from food scraps, packaging, and grease. Ditch overflowing bins and irregular hauls for roll-off dumpster rentals. A 10-15 yard unit centralizes waste, handling bulk like fryer oil drums or produce crates without daily pickups.
Efficiency Over Headcount
Labor's your biggest line item - cross-train staff for multi-roles, like servers prepping during lulls, trimming overtime 10-15 percent. Shift scheduling software optimizes based on reservations, avoiding idle payroll.
Negotiate bulk buys with local suppliers for 5-10 percent discounts; loyalty programs from Sysco yield free deliveries. Go digital - QR menus cut printing costs, speed table turnover, and allow menu updates in real time without waste. Loyalty apps boost repeat visits without increasing your advertising budget, making it easier to track customer preferences and send targeted promotions. Consider bundling purchases with other area restaurants to unlock deeper discounts and leverage supplier relationships for exclusive seasonal specials. These strategies can reduce overhead, improve customer retention, and keep operations flexible as trends shift.

 Highland Builders LLC
Powder room with glam geometric wallpaper complimented with a vessel sink rustic vanity with riveted hardware. Counter top is quartz Viatera - Truffle. Mirror framed wall mirror.
Ryan Hainey
1