
Search results for "Data driven strategies" in Home Design Ideas
 StorageMotion, Inc.
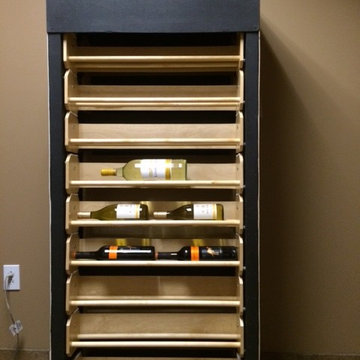
This photo shows how the units look when they leave the factory. A cabinet maker will place it in a nice cabinet with a face frame to display the shelves which are finished in a clear coated Baltic Birch.
See our website www.storagemotion.com

 Bolster
Renovation of a West Village living room by Bolster, a data-driven design-build firm in NYC.
Large elegant formal and open concept dark wood floor, brown floor, exposed beam and wainscoting living room photo in New York with blue walls, a standard fireplace, a concrete fireplace and no tv
Large elegant formal and open concept dark wood floor, brown floor, exposed beam and wainscoting living room photo in New York with blue walls, a standard fireplace, a concrete fireplace and no tv
 Bolster
Renovation of a West Village townhouse bathroom by Bolster, a data-driven design-build firm in NYC.
Example of a small classic master black and white tile and ceramic tile marble floor, gray floor and single-sink bathroom design in New York with open cabinets, a one-piece toilet, white walls, a pedestal sink, marble countertops, gray countertops and a freestanding vanity
Example of a small classic master black and white tile and ceramic tile marble floor, gray floor and single-sink bathroom design in New York with open cabinets, a one-piece toilet, white walls, a pedestal sink, marble countertops, gray countertops and a freestanding vanity
Find the right local pro for your project
 North Texas Low Voltage, L.L.C
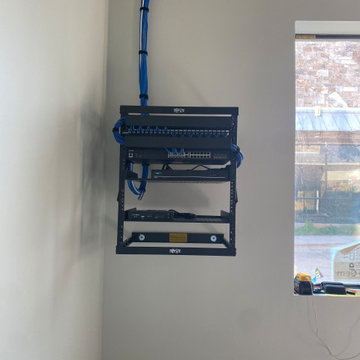
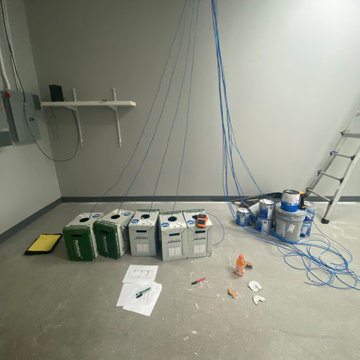
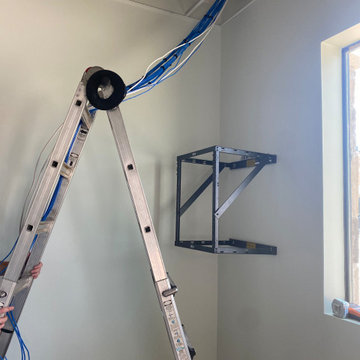
Storage room setup consisting of modular patch panel, POE switch, NVR, Shelves, and firewall
Inspiration for an industrial home design remodel in Dallas
Inspiration for an industrial home design remodel in Dallas
 Bolster
Major gut renovation of an Upper West Side living room by Bolster, NYC's most data-driven design-build firm.
Inspiration for a large contemporary enclosed light wood floor and beige floor living room remodel in New York with white walls, no fireplace and a wall-mounted tv
Inspiration for a large contemporary enclosed light wood floor and beige floor living room remodel in New York with white walls, no fireplace and a wall-mounted tv
 Vincent Designs, Inc.
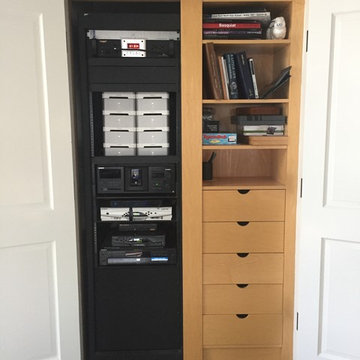
A/V rack hidden away in a family room closet. Housing surge protection, 10 zones of Sonos audio, 300 disk CD changer and a few cable boxes. At my clients beautiful home in Purchase, NY

 Bakhtt Menn
Top 10 SEO Agencies in New York
1. Pearl Lemon: At the top of our list is Pearl Lemon, the epitome of SEO mastery. With a customized approach tailored to meet the specific needs of each client, Pearl Lemon crafts strategies that go beyond traditional paradigms. Their passionate team, driven by a relentless pursuit of innovation, ensures that clients not only achieve higher rankings but also soar above their competition. Through a commitment to long-lasting results and alignment with client objectives, Pearl Lemon emerges as the undisputed champion of New York's SEO landscape.
 Bolster
Renovation of a West Village powder room by Bolster, a data-driven design-build firm in NYC.
Example of a small classic multicolored tile ceramic tile, gray floor, exposed beam and wallpaper powder room design in New York with white cabinets, a one-piece toilet, multicolored walls, a pedestal sink, marble countertops, white countertops and a freestanding vanity
Example of a small classic multicolored tile ceramic tile, gray floor, exposed beam and wallpaper powder room design in New York with white cabinets, a one-piece toilet, multicolored walls, a pedestal sink, marble countertops, white countertops and a freestanding vanity

 safe ZOnea
If you’re active on GardenWeb sharing plant photos, asking for advice, tracking seasonal progress you already understand how much detail goes into gardening. Soil pH, rainfall, emerging leaves, bloom counts, fertilizer schedules it adds up fast. But all that rich information often remains buried in posts, lists or memory. What if you could visualize that data and turn it into clear quick insights? That’s where a graph maker becomes a game-changer for your gardening workflow.
1. Why garden data belongs on a graph
On GardenWeb, you’ll find forums for everything from perennial care, vegetable gardening, patios, herbs, even cooking and craft projects. While plant lovers share observations and ask questions, many track progress manually in spreadsheets or memory. A graph maker flips that around:
Instead of a list of numbers (e.g., “Soil test: pH 6.4 in May, 6.1 in October”), you get a line graph showing the decline over time.
Instead of guessing which plant bloomed most, you see a bar chart comparing counts across plants.
Instead of manually calculating average rainfall effect, you plot scatter points of bloom count vs. rainfall.
By turning your data into visuals, you’re not just recording—you’re analysing, learning and improving. For GardenWeb users this means smarter decisions: Which fertilizer actually improves bloom count? Which shady spot recovers slower? A graph maker gives clarity.
2. What is a graph maker and how to use one
A graph maker is a web tool or software that lets you input raw data (numbers, dates, categories) and output visual charts like line graphs, bar charts, scatter plots, etc. It might allow you to import a spreadsheet, select chart type, customize colours, label axes, and export the image for your blog, forum post or personal log.
Here’s how you could apply it for gardening:
Log blooms per week for each rose plant.
Using the graph maker, choose line graph to track changes over weeks.
Label your y-axis “Number of Blooms”, x-axis “Week of Year”.
Add colour lines for each plant for easy comparison.
Export as PNG and embed it in a GardenWeb forum post: “See bloom trend for my ‘Peace’ vs ‘Knock Out’ roses”.
This isn’t just pretty-to-look-at: it makes the trend obvious, invites discussion (“Hey, your ‘Knock Out’ line dips after week 28—what changed?”) and helps you refine your routine.
3. Use these specific scenarios on GardenWeb
A. Soil pH and plant health tracking
After multiple tests you have pH values over time and bloom results. Upload both datasets into the graph maker, produce a dual-axis line graph: soil pH on one axis, bloom count on the other. Post your findings in the “Soil, Fertility & Nutrients” forum and get feedback.
B. Seasonal pest or disease appearance
Record number of aphids spotted each month and whether you used treatment. A bar chart via the graph maker can show pre- and post-treatment figures. Then ask the “Insect & Disease Control” forum for advice based on your visual data.
C. Yield comparison between varieties
You grow two zucchini varieties. You keep weekly yield in pounds. Use the graph maker for a side-by-side bar chart. Share in the “Vegetable Gardening” forum: “Which was better this year? See the chart”.
D. Rainfall vs growth rate
You log weekly rainfall and growth (in cm) of your tomato plants. Use scatter plot in graph maker. If a pattern emerges, you’re ready to post: “Is my growth plateau due to drought? Chart shows a clear correlation.”
4. Why this elevates your GardenWeb contributions
When you post with a chart made by a graph maker, you’re doing more than asking or showing off. You’re investigating. You’re analysing. You invite the community to give feedback on data, not just anecdotes. That elevates the discussion. Instead of “My plant died, any ideas?” you post “See this graph of pH drop and bloom count—what might be the limiting factor?” High-quality visuals raise your post’s value and garner more thoughtful responses.
Plus, your posts become useful references for others: someone else can say, “Cool graphic, can you share your data sheet?” You build credibility and help the forum become a learning hub—not just a Q&A board.
5. Tips for using a graph maker effectively in the GardenWeb context
Keep it simple: One chart, one insight. Don’t overcrowd.
Label clearly: Titles, axis labels, units (e.g., cm/week, mg/L, °F).
Use readable colours: Avoid faint tones that vanish on mobile.
Annotate when needed: Add notes like “Fertiliser switched week 12” or “Shade cloth added”.
Provide context in your post: Don’t leave the chart alone—write a few sentences explaining what it shows and what you’re seeking.
Embed carefully: Make sure your image displays properly in GardenWeb; check mobile view.
Share raw data: If possible link to your spreadsheet so others can replicate or comment.
Be open to feedback: The chart invites questions; embrace them.
6. Possible pitfalls and how to avoid them
Bad data = bad chart: If your measurements aren’t consistent, your graph will mislead. Use standardized data collection.
Too much complexity: Multi-axis charts, too many variables—confusing. Stick to one or two variables.
Overlooking mobile viewers: Many GardenWeb users browse via phones. Use large fonts and simple visuals.
Ignoring the narrative: Chart alone won’t answer. Explain what it means and what you need.
Outdated charts: If you update your data annually, keep your visuals current or label them clearly as “2024 data”.
7. Final thoughts
On GardenWeb you’ll find a vibrant community of gardeners, DIYers, cooks and design lovers.Using a graph maker for your posts and progress turns your experience from casual hobby-logging into smart data-driven gardening. You’ll not only learn more—your peers will learn more, too.
So next time you log your plant growth, record your yield, test your soil or track pests—don’t just note it. Plot it. Use a graph maker. Share it in the forum. Let your garden tell the story, and let the community help you write the next chapter.
 West Designs - Full Service K+B Designer/Builder
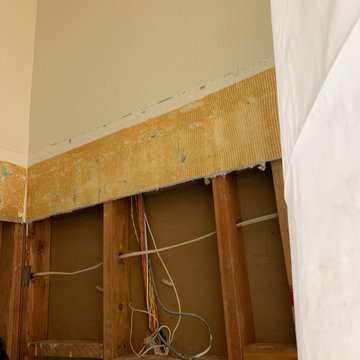
Data & Electrical Lines Behind the Old Shower
Example of a bathroom design in Sacramento
Example of a bathroom design in Sacramento
 Bolster
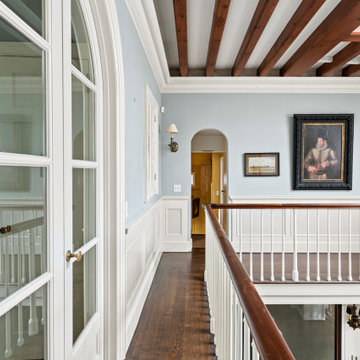
Renovation of a West Village townhouse by Bolster, a data-driven design-build firm in NYC.
Example of a large classic dark wood floor, brown floor, exposed beam and wainscoting hallway design in New York with blue walls
Example of a large classic dark wood floor, brown floor, exposed beam and wainscoting hallway design in New York with blue walls

 Total System Service
As a manager of a building or property, you quickly learn the art of mediation. One minute you may be working with a vendor to keep the building’s operating system running efficient and smooth; the next moment you may be calming a tenant down after finding the change in the system disrupted his office’s workflow. Give and take; it’s the only way to make sure every day runs perfectly.
Overall, you have two goals to strive for in everything you do.
1. Keep the building running properly, upgrading systems as appropriate, and striving to do all you can on a pre-established budget.
2. Keep the building occupants happy, with as little disruption as possible.
While some changes are minor, barely registering on a building occupant’s mind, with HVAC challenges, that’s rarely the case. If a HVAC contractor is replacing an air handler, for instance, and disconnects one and moves to the next unit, it may cause major disruptions to sensitive areas of a building. And if the occupant wasn’t prepared for the disruption, you can have a mighty unhappy customer on your hand.
Anytime you are working on HVAC projects throughout your building, there are strategies you can put into place to keep things running smooth.
Communicate with occupants
Communication is key to any good relationship, and as a property manager, this rule is a great place to start. If you will be working with the HVAC equipment, block out the timeframe for work to be done, and understand the potential consequences of the process. Then communicate this process with every point of contact you have throughout the building. The more detail you can provide, the less surprises you’ll have throughout the process. You can also work with your building’s occupants before the process begins, finding out if there are better timeframes than others.
Establish a realistic schedule
As a property manager, its easy to provide your expectations for the HVAC project at hand, and request that the proposal be written in such a way that work is completed on your timeframe. Unfortunately, many contractors want your business and will agree to anything upfront in order to win the bid, knowing full well the work will take longer than specified. Instead of projecting your timeframes into the proposal process, ask for HVAC project bids to establish realistic schedules of how long the process will take, and what areas of your property will be most effected throughout the schedule. This will help you avoid crises between you and the contractor, and you and your tenants.
Plan for the whole system
If one small piece of your HVAC system is weak, its easy to fix that one small piece. But how will that impact your overall system? Will it cause weak spots in different parts of the building – maybe a corner office will have reduced air flow, and therefore be colder in the winter and warmer in the summer? When retrofitting new pieces with older existing systems, its easy to reduce the efficiency of your entire system. Before agreeing to certain repairs, make sure you understand how it will impact your entire system overall. An easy way of handling this problem is by working with the same HVAC contractor again and again, He will understand your system’s potential, and know when to make repairs, and when to replace.
Have points of contact available for immediate assistance
In many cases, problems arise because connections can’t be made. Can the HVAC contractor get a hold or you or another person that can make decisions at a moments notice if a problem arises? Do you have access to decision makers throughout the building that may be impacted by this change? Many projects have been put on hold simply because a person in authority can’t be found to give the go-ahead to move forward. If you have access to these people during the time of the project, you’ll be able to complete the project in record time.
Test
Finally, if you can test things in stages, or test when the potential for problems is the smallest, you reduce the chances of bigger emergency issues falling into your lap. If you’ll be installing a new terminal unit, can you make the switch on a Saturday morning when the building is largely unoccupied? If you’re replacing a large system, can you replace and test in phases so the entire project isn’t released at once?
Most issues can be avoided with just a little strategy from the beginning. If you’ve never had a HVAC maintenance team to help you stay on track with your building’s heating and cooling, now may be the time to find out how easy a team approach makes the process.
 Vincent Designs, Inc.
A/V rack hidden away in a family room closet. Housing surge protection, 10 zones of Sonos audio, 300 disk CD changer and a few cable boxes. At my clients beautiful home in Purchase, NY
 Dina2Decor Construction & Interior Design
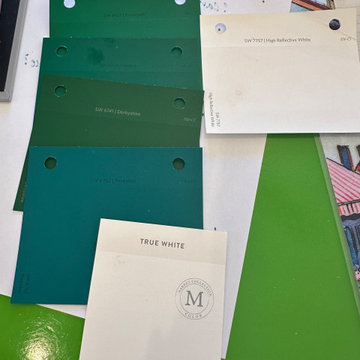
A look into our extensive color consultation and refinement process. To achieve the perfect balance for the artist client's eclectic home, we tested numerous options to find the ideal crisp white for the walls, ceilings, and upper cabinets, paired with a curated statement green for the lower cabinetry to seamlessly ground the open-concept space.
 Business_Name_Placeholder
Pipex.ai is a trusted B2B platform connecting verified buyers and sellers worldwide, helping businesses simplify sourcing without acting as a manufacturer. Companies seeking reliable supply channels often collaborate with a dependable Carbon Steel Round Bars Supplier in Saudi Arabia, while strengthening production partnerships through an experienced Carbon Steel Round Bars Manufacturer in India, ensuring consistent quality and smooth project execution across diverse industrial sectors.
Carbon steel round bars are widely used in construction, fabrication, automotive, and heavy engineering industries due to their strength, machinability, and durability. Businesses expanding into regional markets benefit from working with a reliable Carbon Steel Round Bars Exporter in Saudi Arabia, enabling efficient logistics and access to high-demand infrastructure and energy projects that require precision-engineered materials.
This marketing-driven trade ecosystem supports scalable growth for both buyers and suppliers. Procurement teams enhance sourcing flexibility by engaging with a trusted Carbon Steel Round Bars Supplier in India, while global expansion strategies are strengthened through collaboration with an established Carbon Steel Round Bars Exporter, creating transparent communication, competitive visibility, and long-term industrial partnerships.



 A2T studio Milano
Dining room and living room linked with the kitchen by a beautiful bronzed glass sliding door.
Inspiration for a large contemporary open concept light wood floor living room remodel in Milan with beige walls
Inspiration for a large contemporary open concept light wood floor living room remodel in Milan with beige walls
4