
Search results for "Peer to peer" in Home Design Ideas


 United Porte Inc
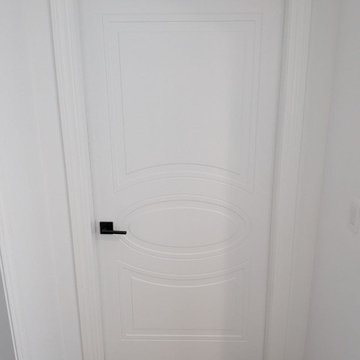
Mela 7001 White Silk Concealed Metal Frame 42" x 80" Left-hand Inswing Description
Set includes:
Pre-drilled door slab.
Metal invisible frame (3 pcs) made of cold-rolled galvanized steel, with connectors and screws.
3D-adjustable concealed hinges.
American style or European style handle and lock (per your choice).
Door model – 7001
Coating – painted
Door thickness – 1 1/2"
Door core – solid wood.
Modern frameless design makes this door a perfect solution for stylish interiors. Thanks to the minimalist look and absence of visible trims, it visually expands the space and blends seamlessly into any room.
The eco-veneer coating is durable, scratch-resistant, easy to maintain, and designed for long-lasting performance. The engineered solid wood core provides strength, stability, sound reduction, and helps preserve heat inside the room.
Door can be chosen with inswing or outswing direction. Flush design is available from one side only to achieve a clean invisible frame look.
The invisible frame is resistant to mechanical damage and corrosion. Extensions are available to cover a wall up to 7".
Frame should be spackled and painted after installation to achieve a seamless invisible frame finish that integrates perfectly with the wall surface.


Find the right local pro for your project

 Wright Ostermier Landscape Architects
With their recently purchased home, the clients wanted to add a pool & spa to their backyard, with a space for entertaining. They also needed a new driveway with additional parking spots, without disturbing their entire front yard.
To address their needs and reflect their taste and lifestyle, a design with a broad set of stairs which opens out to the landscape, descending to a perched pool, was developed. A parapet wall provides an edge to the pool, while woodland plantings frame the view to the conservation area and transcends the boundary between yard and wild.
Photography by Neil Landino, designed while at Dan Gordon Landscape Architects


 Preservation Tree Services
Dallas Baptist University cares about the health of their beautiful established Live Oaks. In order to increase sunlight to permeate through the entire tree, we cleaned the canopy of any dead, dying, diseased, or crossing limbs.
Another goal of theirs is to achieve a canopy over along the road throughout he campus. Properly pruning LIve Oak trees will give them a gorgeous shape and improve future growth.
PHOTO: Preservation Tree Services





 safe ZOnea
If you’re active on GardenWeb sharing plant photos, asking for advice, tracking seasonal progress you already understand how much detail goes into gardening. Soil pH, rainfall, emerging leaves, bloom counts, fertilizer schedules it adds up fast. But all that rich information often remains buried in posts, lists or memory. What if you could visualize that data and turn it into clear quick insights? That’s where a graph maker becomes a game-changer for your gardening workflow.
1. Why garden data belongs on a graph
On GardenWeb, you’ll find forums for everything from perennial care, vegetable gardening, patios, herbs, even cooking and craft projects. While plant lovers share observations and ask questions, many track progress manually in spreadsheets or memory. A graph maker flips that around:
Instead of a list of numbers (e.g., “Soil test: pH 6.4 in May, 6.1 in October”), you get a line graph showing the decline over time.
Instead of guessing which plant bloomed most, you see a bar chart comparing counts across plants.
Instead of manually calculating average rainfall effect, you plot scatter points of bloom count vs. rainfall.
By turning your data into visuals, you’re not just recording—you’re analysing, learning and improving. For GardenWeb users this means smarter decisions: Which fertilizer actually improves bloom count? Which shady spot recovers slower? A graph maker gives clarity.
2. What is a graph maker and how to use one
A graph maker is a web tool or software that lets you input raw data (numbers, dates, categories) and output visual charts like line graphs, bar charts, scatter plots, etc. It might allow you to import a spreadsheet, select chart type, customize colours, label axes, and export the image for your blog, forum post or personal log.
Here’s how you could apply it for gardening:
Log blooms per week for each rose plant.
Using the graph maker, choose line graph to track changes over weeks.
Label your y-axis “Number of Blooms”, x-axis “Week of Year”.
Add colour lines for each plant for easy comparison.
Export as PNG and embed it in a GardenWeb forum post: “See bloom trend for my ‘Peace’ vs ‘Knock Out’ roses”.
This isn’t just pretty-to-look-at: it makes the trend obvious, invites discussion (“Hey, your ‘Knock Out’ line dips after week 28—what changed?”) and helps you refine your routine.
3. Use these specific scenarios on GardenWeb
A. Soil pH and plant health tracking
After multiple tests you have pH values over time and bloom results. Upload both datasets into the graph maker, produce a dual-axis line graph: soil pH on one axis, bloom count on the other. Post your findings in the “Soil, Fertility & Nutrients” forum and get feedback.
B. Seasonal pest or disease appearance
Record number of aphids spotted each month and whether you used treatment. A bar chart via the graph maker can show pre- and post-treatment figures. Then ask the “Insect & Disease Control” forum for advice based on your visual data.
C. Yield comparison between varieties
You grow two zucchini varieties. You keep weekly yield in pounds. Use the graph maker for a side-by-side bar chart. Share in the “Vegetable Gardening” forum: “Which was better this year? See the chart”.
D. Rainfall vs growth rate
You log weekly rainfall and growth (in cm) of your tomato plants. Use scatter plot in graph maker. If a pattern emerges, you’re ready to post: “Is my growth plateau due to drought? Chart shows a clear correlation.”
4. Why this elevates your GardenWeb contributions
When you post with a chart made by a graph maker, you’re doing more than asking or showing off. You’re investigating. You’re analysing. You invite the community to give feedback on data, not just anecdotes. That elevates the discussion. Instead of “My plant died, any ideas?” you post “See this graph of pH drop and bloom count—what might be the limiting factor?” High-quality visuals raise your post’s value and garner more thoughtful responses.
Plus, your posts become useful references for others: someone else can say, “Cool graphic, can you share your data sheet?” You build credibility and help the forum become a learning hub—not just a Q&A board.
5. Tips for using a graph maker effectively in the GardenWeb context
Keep it simple: One chart, one insight. Don’t overcrowd.
Label clearly: Titles, axis labels, units (e.g., cm/week, mg/L, °F).
Use readable colours: Avoid faint tones that vanish on mobile.
Annotate when needed: Add notes like “Fertiliser switched week 12” or “Shade cloth added”.
Provide context in your post: Don’t leave the chart alone—write a few sentences explaining what it shows and what you’re seeking.
Embed carefully: Make sure your image displays properly in GardenWeb; check mobile view.
Share raw data: If possible link to your spreadsheet so others can replicate or comment.
Be open to feedback: The chart invites questions; embrace them.
6. Possible pitfalls and how to avoid them
Bad data = bad chart: If your measurements aren’t consistent, your graph will mislead. Use standardized data collection.
Too much complexity: Multi-axis charts, too many variables—confusing. Stick to one or two variables.
Overlooking mobile viewers: Many GardenWeb users browse via phones. Use large fonts and simple visuals.
Ignoring the narrative: Chart alone won’t answer. Explain what it means and what you need.
Outdated charts: If you update your data annually, keep your visuals current or label them clearly as “2024 data”.
7. Final thoughts
On GardenWeb you’ll find a vibrant community of gardeners, DIYers, cooks and design lovers.Using a graph maker for your posts and progress turns your experience from casual hobby-logging into smart data-driven gardening. You’ll not only learn more—your peers will learn more, too.
So next time you log your plant growth, record your yield, test your soil or track pests—don’t just note it. Plot it. Use a graph maker. Share it in the forum. Let your garden tell the story, and let the community help you write the next chapter.
134