
Search results for "Share tips" in Home Design Ideas
 Northworks Architects + Planners
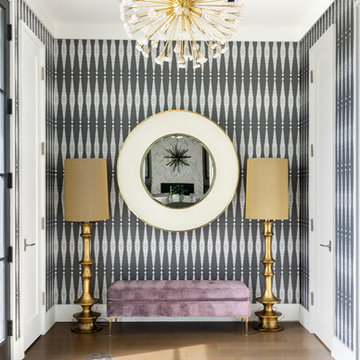
Foyer - contemporary medium tone wood floor foyer idea in Chicago with multicolored walls

 Martin Kobus Home
An extraordinary WARHOL collection was the starting point of this project for a family with young kids in need of functional yet stylish interiors. Brightly colored, lacquered walls are the backdrop for the art which dictated the colors used. Custom built-ins and 3 dimensional walls add interest and definition to the spaces. A Missoni carpet connects the dots.
Photography by: David Duncan Livingston


Find the right local pro for your project
 Frankel Design Build
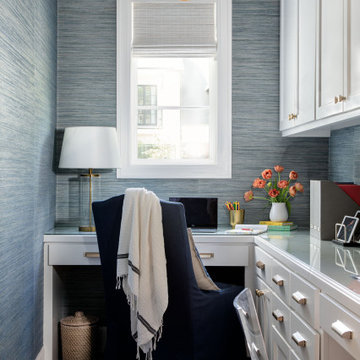
Example of a huge trendy built-in desk wallpaper study room design in Houston with blue walls
 DDK Kitchen Design Group
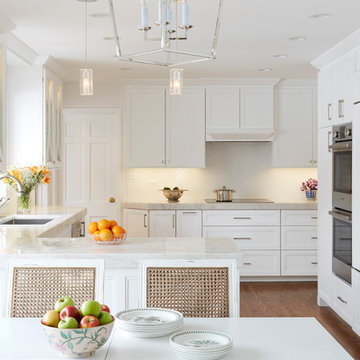
Tip of the iceberg. This stunning kitchen is a beautiful example of a custom kitchen you can not find everywhere.
Notice the beautiful mullions glass doors on both sides of
the sink. The sub zero refrigerator is covered while the dishwasher and ovens are revealing stainless. This is a functional kitchen the begs to be admired.
Designed by Dana Martin for DDK Kitchen Design Group. Photographed by Mike Kaskel. Cabinets by Dutch Made Cabinetry. Countertops by TIthof Tile.

 JENNIFER GIERSBROOK INTERIOR DESIGN
Inspiration for a mid-sized contemporary open concept white floor and porcelain tile living room remodel in Los Angeles with white walls, no fireplace and no tv

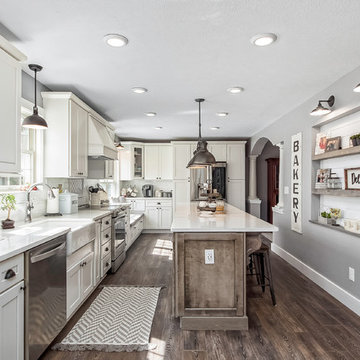
Sponsored
Sunbury, OH

J.Holderby - Renovations
Franklin County's Leading General Contractors - 2X Best of Houzz!
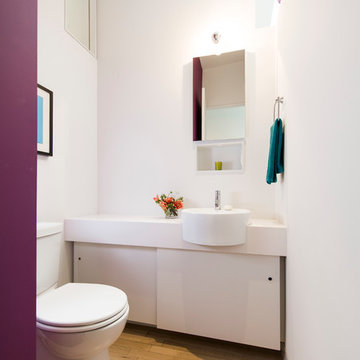
 EL Studio
Pepper Watkins
Inspiration for a scandinavian medium tone wood floor powder room remodel in DC Metro with flat-panel cabinets, white cabinets, a two-piece toilet, white walls and white countertops
Inspiration for a scandinavian medium tone wood floor powder room remodel in DC Metro with flat-panel cabinets, white cabinets, a two-piece toilet, white walls and white countertops

 City Park Interiors
Inspiration for a large timeless open concept dark wood floor living room remodel in Columbus with beige walls, a standard fireplace, a stone fireplace and no tv

 Set To Sell, LLC
The Greater Birmingham Association of Homebuilders, 2016 Parade of Homes Ideal Home.
A Showcase Home for Southern Living.
Built by J. Wright Building Company.
Interior Decoration and Staging by Set to Sell.
Photographer: Graham Yelton


 Tricia Fortin Interiors
Layered in timeless blues, soft greens, and warm creams, this space balances tradition with everyday comfort. Thoughtfully designed with family in mind, the room invites both connection and quiet moments—ample seating encourages gathering, while a dedicated game table sets the stage for friendly competition and shared memories. A traditional secretary desk adds a functional, collected touch, perfect for homework, correspondence, or simply keeping life organized.
Comfortable, classic, and meant to be lived in—this is a living room where style and family life coexist beautifully.
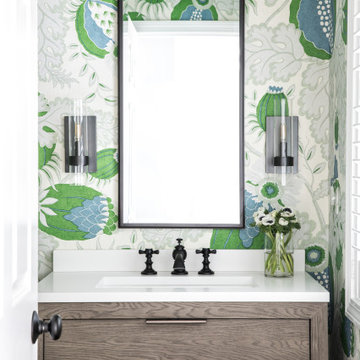
 kelly mcguill home
Inspiration for a transitional powder room remodel in Boston with flat-panel cabinets, gray cabinets, multicolored walls, an undermount sink and white countertops

 McGuire + Co. Kitchen & Bath
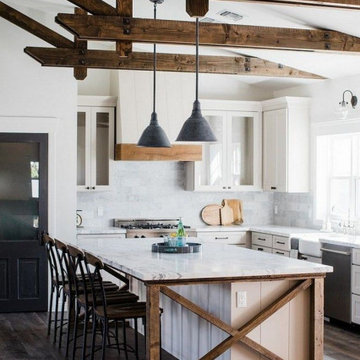
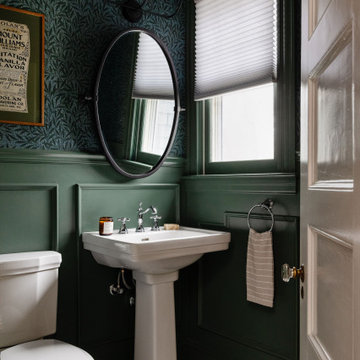
Design-build kitchen, powder room, and butler’s pantry remodel in an 1890 Victorian home in Wakefield, MA. Full renovation included reconfiguring the powder room layout and opening a load-bearing wall between the kitchen and dining room to improve flow and functionality.
Kitchen remodel features frameless full overlay cabinetry in Steel Blue, quartz countertops (Alleanza Dolomiti Extra), beveled crackle tile backsplash, and hardwood flooring. Island addition replaces freestanding table and adds prep space with microwave drawer. Full-height wall cabinets maximize kitchen storage. Historic-inspired details include ogee-edge countertops, bridge-style faucet in English Bronze, decorative corbels, polished nickel hardware, and industrial-style sconces.
Powder room renovation includes reduced footprint layout, basketweave floor tile, applied molding, wallpaper, and vintage-inspired plumbing fixtures in chrome.
Butler’s pantry remodel features inset cherry cabinetry in a coffee stain finish, quartz countertops, glass-front cabinets, beverage fridge, bar sink, and wallpapered cabinetry interiors. Designed as a functional wet bar and storage extension off dining room.
Style: Traditional / Victorian kitchen remodel, historic home renovation, design-build remodeling contractor Wakefield MA.

 Carolyn Reyes
Photo: Carolyn Reyes © 2016 Houzz
Family Room
Example of a transitional living room design in Los Angeles
Example of a transitional living room design in Los Angeles
 Taylor Knights
Peter Clarke
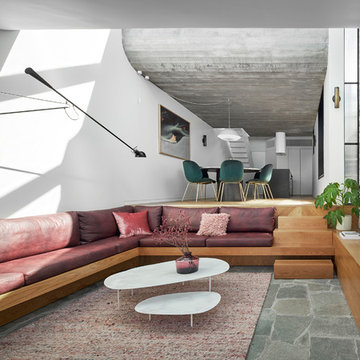
Living room - mid-sized contemporary open concept limestone floor and gray floor living room idea in Melbourne with white walls, no fireplace and no tv
Living room - mid-sized contemporary open concept limestone floor and gray floor living room idea in Melbourne with white walls, no fireplace and no tv
Sponsored
Columbus, OH

Hope Restoration & General Contracting
Columbus Design-Build, Kitchen & Bath Remodeling, Historic Renovations

 safe ZOnea
If you’re active on GardenWeb sharing plant photos, asking for advice, tracking seasonal progress you already understand how much detail goes into gardening. Soil pH, rainfall, emerging leaves, bloom counts, fertilizer schedules it adds up fast. But all that rich information often remains buried in posts, lists or memory. What if you could visualize that data and turn it into clear quick insights? That’s where a graph maker becomes a game-changer for your gardening workflow.
1. Why garden data belongs on a graph
On GardenWeb, you’ll find forums for everything from perennial care, vegetable gardening, patios, herbs, even cooking and craft projects. While plant lovers share observations and ask questions, many track progress manually in spreadsheets or memory. A graph maker flips that around:
Instead of a list of numbers (e.g., “Soil test: pH 6.4 in May, 6.1 in October”), you get a line graph showing the decline over time.
Instead of guessing which plant bloomed most, you see a bar chart comparing counts across plants.
Instead of manually calculating average rainfall effect, you plot scatter points of bloom count vs. rainfall.
By turning your data into visuals, you’re not just recording—you’re analysing, learning and improving. For GardenWeb users this means smarter decisions: Which fertilizer actually improves bloom count? Which shady spot recovers slower? A graph maker gives clarity.
2. What is a graph maker and how to use one
A graph maker is a web tool or software that lets you input raw data (numbers, dates, categories) and output visual charts like line graphs, bar charts, scatter plots, etc. It might allow you to import a spreadsheet, select chart type, customize colours, label axes, and export the image for your blog, forum post or personal log.
Here’s how you could apply it for gardening:
Log blooms per week for each rose plant.
Using the graph maker, choose line graph to track changes over weeks.
Label your y-axis “Number of Blooms”, x-axis “Week of Year”.
Add colour lines for each plant for easy comparison.
Export as PNG and embed it in a GardenWeb forum post: “See bloom trend for my ‘Peace’ vs ‘Knock Out’ roses”.
This isn’t just pretty-to-look-at: it makes the trend obvious, invites discussion (“Hey, your ‘Knock Out’ line dips after week 28—what changed?”) and helps you refine your routine.
3. Use these specific scenarios on GardenWeb
A. Soil pH and plant health tracking
After multiple tests you have pH values over time and bloom results. Upload both datasets into the graph maker, produce a dual-axis line graph: soil pH on one axis, bloom count on the other. Post your findings in the “Soil, Fertility & Nutrients” forum and get feedback.
B. Seasonal pest or disease appearance
Record number of aphids spotted each month and whether you used treatment. A bar chart via the graph maker can show pre- and post-treatment figures. Then ask the “Insect & Disease Control” forum for advice based on your visual data.
C. Yield comparison between varieties
You grow two zucchini varieties. You keep weekly yield in pounds. Use the graph maker for a side-by-side bar chart. Share in the “Vegetable Gardening” forum: “Which was better this year? See the chart”.
D. Rainfall vs growth rate
You log weekly rainfall and growth (in cm) of your tomato plants. Use scatter plot in graph maker. If a pattern emerges, you’re ready to post: “Is my growth plateau due to drought? Chart shows a clear correlation.”
4. Why this elevates your GardenWeb contributions
When you post with a chart made by a graph maker, you’re doing more than asking or showing off. You’re investigating. You’re analysing. You invite the community to give feedback on data, not just anecdotes. That elevates the discussion. Instead of “My plant died, any ideas?” you post “See this graph of pH drop and bloom count—what might be the limiting factor?” High-quality visuals raise your post’s value and garner more thoughtful responses.
Plus, your posts become useful references for others: someone else can say, “Cool graphic, can you share your data sheet?” You build credibility and help the forum become a learning hub—not just a Q&A board.
5. Tips for using a graph maker effectively in the GardenWeb context
Keep it simple: One chart, one insight. Don’t overcrowd.
Label clearly: Titles, axis labels, units (e.g., cm/week, mg/L, °F).
Use readable colours: Avoid faint tones that vanish on mobile.
Annotate when needed: Add notes like “Fertiliser switched week 12” or “Shade cloth added”.
Provide context in your post: Don’t leave the chart alone—write a few sentences explaining what it shows and what you’re seeking.
Embed carefully: Make sure your image displays properly in GardenWeb; check mobile view.
Share raw data: If possible link to your spreadsheet so others can replicate or comment.
Be open to feedback: The chart invites questions; embrace them.
6. Possible pitfalls and how to avoid them
Bad data = bad chart: If your measurements aren’t consistent, your graph will mislead. Use standardized data collection.
Too much complexity: Multi-axis charts, too many variables—confusing. Stick to one or two variables.
Overlooking mobile viewers: Many GardenWeb users browse via phones. Use large fonts and simple visuals.
Ignoring the narrative: Chart alone won’t answer. Explain what it means and what you need.
Outdated charts: If you update your data annually, keep your visuals current or label them clearly as “2024 data”.
7. Final thoughts
On GardenWeb you’ll find a vibrant community of gardeners, DIYers, cooks and design lovers.Using a graph maker for your posts and progress turns your experience from casual hobby-logging into smart data-driven gardening. You’ll not only learn more—your peers will learn more, too.
So next time you log your plant growth, record your yield, test your soil or track pests—don’t just note it. Plot it. Use a graph maker. Share it in the forum. Let your garden tell the story, and let the community help you write the next chapter.

 Chango
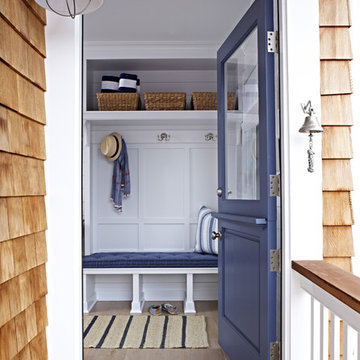
Interior Architecture, Interior Design, Art Curation, and Custom Millwork & Furniture Design by Chango & Co.
Construction by Siano Brothers Contracting
Photography by Jacob Snavely
See the full feature inside Good Housekeeping
52