
Search results for "Casual browsing" in Home Design Ideas
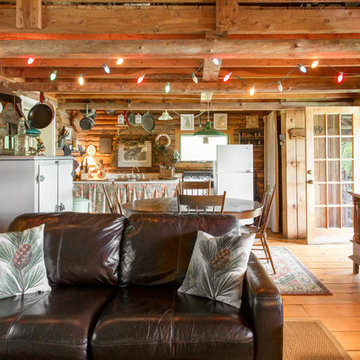

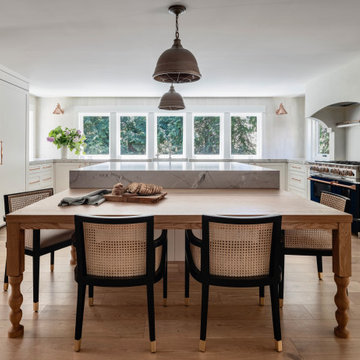


 Bakes & Kropp Fine Cabinetry
For this newly-built waterfront home on Long Island’s north shore, Bakes & Kropp designed a modern, transitional kitchen and complimentary bathroom spaces. Led by Senior Kitchen Designer Mary Dimichino, the design team drew inspiration from the peaceful water vista framed by the kitchen windows. The result is an open, airy space with clean lines and a soothing mixture of white and walnut finishes tempered by polished metal accents.
Find the right local pro for your project
 Wesley-Wayne Interiors, LLC
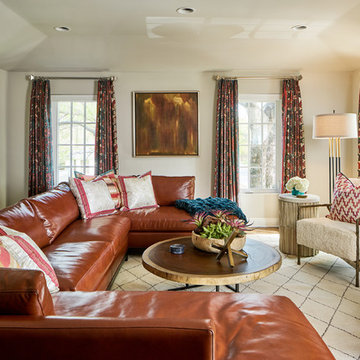
This secondary living space upstairs is perfect for watching TV and casual entertaining. This client loves the desert, so the color and pattern selections were born from there. The large sienna brown leather sectional is inviting and comfortable. The pillows and window treatment feature tribal patterns. With the use of softer sunset tones mixed with rich turquoise, we were able to add a bit of modernity as well as femininity. The original kitchen windows were floated in an acrylic box to be used as artwork that nod to the antiquities that were once part of the home's structure. A pair of faux lambswool upholstered chairs flank the fireplace for a cozy spot to curl up next to with a book. A large tree trunk cocktail table adds a natural element, color and texture.
Design by: Wesley-Wayne Interiors
Photo by: Stephen Karlisch
 Karen Gallagher Interiors
photography by Courtney Elizabeth
Transitional dining room photo in Portland Maine
Transitional dining room photo in Portland Maine
 Falken Reynolds Interiors
Photo: Janis Nicolay
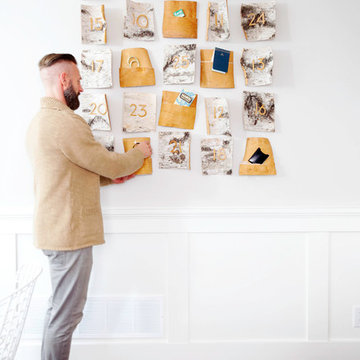
A partial renovation and complete furniture package for this home in Vancouver delivered modern and authentic spaces for a young family. The craftsman bones of the house were honoured and a 90’s fireplace was replaced with a modern version that blends into the wainscotting and allows the TV to be recessed above. Modern furniture and lighting were kept in a light neutral palette to emphasize the space and create a feeling of calm treasured after a busy day at the office. A mix of Italian and locally crafted pieces create a layered sense of home and a unique balance of sophistication and casualness. Falken Reynolds added a unique take on Holiday decorating for a feature in Western Living Magazine.
 Boss Design Center
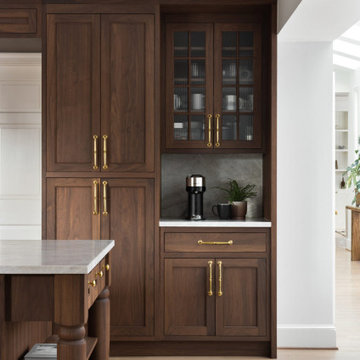
This custom kitchen pairs deep walnut cabinetry with soft cream perimeter cabinets to create a warm, inviting atmosphere. A statement stone slab backsplash anchors the cooking wall, framed by tailored millwork and subtle brass detailing. The oversized island offers generous prep space, integrated storage, and open shelving, making it ideal for daily cooking and casual gatherings. Glass-front cabinets, layered lighting, and natural wood flooring complete the look, blending classic craftsmanship with clean, modern lines for a refined yet comfortable kitchen design.


 Demlang Builders
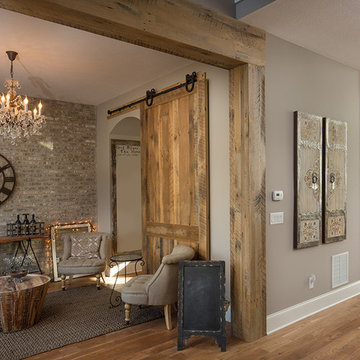
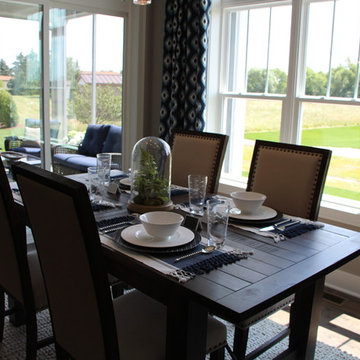
Close your eyes, and imagine…You just finished Thanksgiving dinner – all the fixin’s surrounded by friends and family in your new Demlang home. In this kitchen with Zodiac quartz countertops, Kohler Vault stainless sink, and a pull-out Tournant faucet, you’ll make short work of the dishes. Leftovers are quickly stashed away in the Bosch French door stainless refrigerator, leaving you to enjoy the again clean island, adorned by a hand-scraped birch soffit with industrial pendant lights.
Gather in the great room and gaze up at the soaring ceilings with rustic beamed treatment, unbuckle your belt a notch and let the food coma kick-in while the tranquil flames dance in the Heat & Glo corner gas fireplace.
As the ritual game of Sheepshead is kicked off in the rustic covered retreat, the bargain hunters browse ads preparing for the big shopping day. The kids land in the Command Center, playing computer games while dishtowels and linens are washed in this multi-functional room.
All you can wonder is when everyone is going home – leaving you to retreat to your master suite, thankful you only have to host once a year!
Black Friday arrives, and the aroma of fresh brewed coffee fills your master suite. As you sip coffee in your mirrored dressing room, you make sure your Black Friday yoga pants look just right. Who says life has to be stressful!
 Cantoni
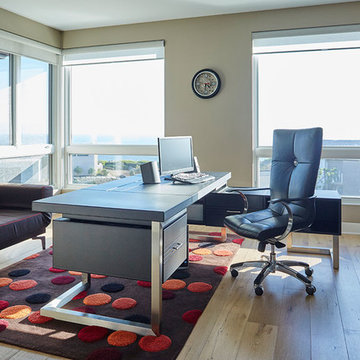
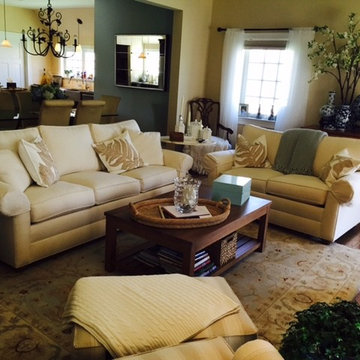
Cantoni design consultant Sarah Buehlman brings a casual yet elegant coastal vibe to a Monarch Beach home overlooking the water. To read the full story, click here: http://cantoni.com/interior-design-services/projects/a-tranquil-beach-house/
Photos by Thang Troung

 Century Custom Hardwood Floor Inc.
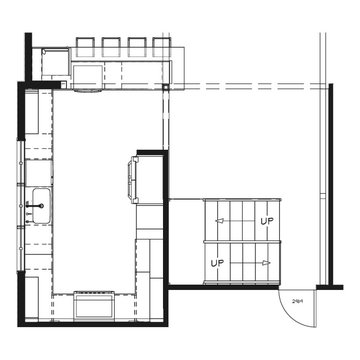
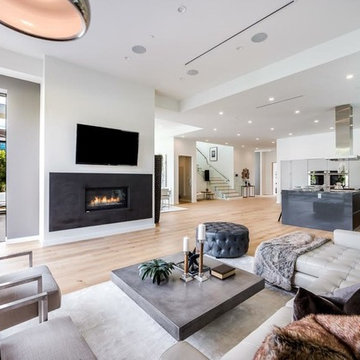
Whether you are looking for a formal sitting room design or a casual living space to spend time with your family and friends, find living room ideas that expand your style. Hardwood Flooring adds real value to your home, it stays durable enough to last a lifetime.
Follow our Instagram, browse LinkedIn, Facebook, Houzz, Google+ and Pinterest for new flooring ideas and Yelp for the reviews of our happy and satisfied customer or visit our website: www.centurycustomhardwoodfloor.net for more flooring ideas
Call today for a Free Estimate on a new set of hardwood flooring 1-800-608-6007! |
Based in Los Angeles California

 Shelly Sullivan Events
Shelly Sullivan Events
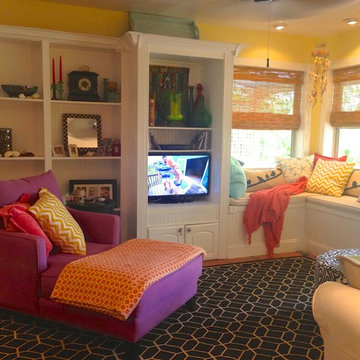
Cozy corner to browse houzz
Example of a beach style home design design in Miami
Example of a beach style home design design in Miami
 Transitions Kitchens and Baths
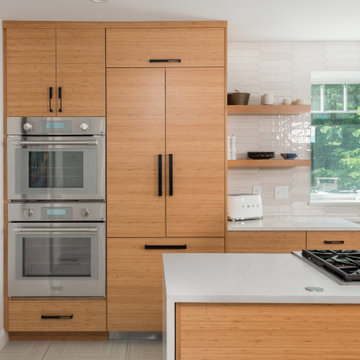
This Hanover kitchen remodel is a study in clean lines. Flat-panel wood Mouser cabinetry sets a quiet, modern tone, paired with matte black hardware and a white quartz countertop that keeps the room bright.The U-shaped layout makes the most of a narrow footprint with smart storage and full work zones along every wall. Wall cabinets are broken up by open display shelving, which keeps the space from feeling closed in and adds a casual, lived-in feel.The kitchen flows directly into the dining area and adjacent living room, so the open palette helps the whole first floor read as one connected space.Browse more completed kitchens on the South Shore or schedule a showroom visit to talk through your own.

 safe ZOnea
If you’re active on GardenWeb sharing plant photos, asking for advice, tracking seasonal progress you already understand how much detail goes into gardening. Soil pH, rainfall, emerging leaves, bloom counts, fertilizer schedules it adds up fast. But all that rich information often remains buried in posts, lists or memory. What if you could visualize that data and turn it into clear quick insights? That’s where a graph maker becomes a game-changer for your gardening workflow.
1. Why garden data belongs on a graph
On GardenWeb, you’ll find forums for everything from perennial care, vegetable gardening, patios, herbs, even cooking and craft projects. While plant lovers share observations and ask questions, many track progress manually in spreadsheets or memory. A graph maker flips that around:
Instead of a list of numbers (e.g., “Soil test: pH 6.4 in May, 6.1 in October”), you get a line graph showing the decline over time.
Instead of guessing which plant bloomed most, you see a bar chart comparing counts across plants.
Instead of manually calculating average rainfall effect, you plot scatter points of bloom count vs. rainfall.
By turning your data into visuals, you’re not just recording—you’re analysing, learning and improving. For GardenWeb users this means smarter decisions: Which fertilizer actually improves bloom count? Which shady spot recovers slower? A graph maker gives clarity.
2. What is a graph maker and how to use one
A graph maker is a web tool or software that lets you input raw data (numbers, dates, categories) and output visual charts like line graphs, bar charts, scatter plots, etc. It might allow you to import a spreadsheet, select chart type, customize colours, label axes, and export the image for your blog, forum post or personal log.
Here’s how you could apply it for gardening:
Log blooms per week for each rose plant.
Using the graph maker, choose line graph to track changes over weeks.
Label your y-axis “Number of Blooms”, x-axis “Week of Year”.
Add colour lines for each plant for easy comparison.
Export as PNG and embed it in a GardenWeb forum post: “See bloom trend for my ‘Peace’ vs ‘Knock Out’ roses”.
This isn’t just pretty-to-look-at: it makes the trend obvious, invites discussion (“Hey, your ‘Knock Out’ line dips after week 28—what changed?”) and helps you refine your routine.
3. Use these specific scenarios on GardenWeb
A. Soil pH and plant health tracking
After multiple tests you have pH values over time and bloom results. Upload both datasets into the graph maker, produce a dual-axis line graph: soil pH on one axis, bloom count on the other. Post your findings in the “Soil, Fertility & Nutrients” forum and get feedback.
B. Seasonal pest or disease appearance
Record number of aphids spotted each month and whether you used treatment. A bar chart via the graph maker can show pre- and post-treatment figures. Then ask the “Insect & Disease Control” forum for advice based on your visual data.
C. Yield comparison between varieties
You grow two zucchini varieties. You keep weekly yield in pounds. Use the graph maker for a side-by-side bar chart. Share in the “Vegetable Gardening” forum: “Which was better this year? See the chart”.
D. Rainfall vs growth rate
You log weekly rainfall and growth (in cm) of your tomato plants. Use scatter plot in graph maker. If a pattern emerges, you’re ready to post: “Is my growth plateau due to drought? Chart shows a clear correlation.”
4. Why this elevates your GardenWeb contributions
When you post with a chart made by a graph maker, you’re doing more than asking or showing off. You’re investigating. You’re analysing. You invite the community to give feedback on data, not just anecdotes. That elevates the discussion. Instead of “My plant died, any ideas?” you post “See this graph of pH drop and bloom count—what might be the limiting factor?” High-quality visuals raise your post’s value and garner more thoughtful responses.
Plus, your posts become useful references for others: someone else can say, “Cool graphic, can you share your data sheet?” You build credibility and help the forum become a learning hub—not just a Q&A board.
5. Tips for using a graph maker effectively in the GardenWeb context
Keep it simple: One chart, one insight. Don’t overcrowd.
Label clearly: Titles, axis labels, units (e.g., cm/week, mg/L, °F).
Use readable colours: Avoid faint tones that vanish on mobile.
Annotate when needed: Add notes like “Fertiliser switched week 12” or “Shade cloth added”.
Provide context in your post: Don’t leave the chart alone—write a few sentences explaining what it shows and what you’re seeking.
Embed carefully: Make sure your image displays properly in GardenWeb; check mobile view.
Share raw data: If possible link to your spreadsheet so others can replicate or comment.
Be open to feedback: The chart invites questions; embrace them.
6. Possible pitfalls and how to avoid them
Bad data = bad chart: If your measurements aren’t consistent, your graph will mislead. Use standardized data collection.
Too much complexity: Multi-axis charts, too many variables—confusing. Stick to one or two variables.
Overlooking mobile viewers: Many GardenWeb users browse via phones. Use large fonts and simple visuals.
Ignoring the narrative: Chart alone won’t answer. Explain what it means and what you need.
Outdated charts: If you update your data annually, keep your visuals current or label them clearly as “2024 data”.
7. Final thoughts
On GardenWeb you’ll find a vibrant community of gardeners, DIYers, cooks and design lovers.Using a graph maker for your posts and progress turns your experience from casual hobby-logging into smart data-driven gardening. You’ll not only learn more—your peers will learn more, too.
So next time you log your plant growth, record your yield, test your soil or track pests—don’t just note it. Plot it. Use a graph maker. Share it in the forum. Let your garden tell the story, and let the community help you write the next chapter.
 HOME FASHION INTERIORS
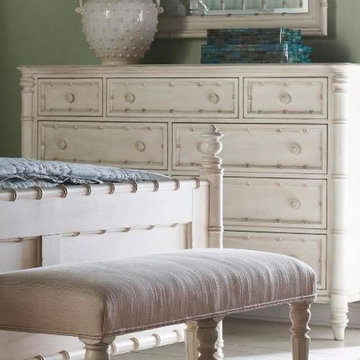
The finest combination of casual and elegant. For more information about this Bamboo Dresser by Fine Furniture Design. Give us a call at 770-285-7849 or visit us online at http://tinyurl.com/ofor7z3 for more info or to browse our great selection of home furniture and decor.
10