
Search results for "Spreadsheet" in Home Design Ideas


 KINGDOM WOODWORKS
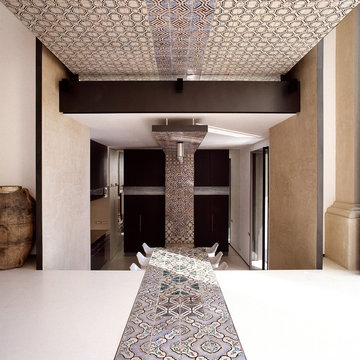
Collaboration with Canonbury Homes and Frank Neely Design Associates.
Inspiration for a timeless open concept kitchen remodel in Atlanta with beaded inset cabinets and two islands
Inspiration for a timeless open concept kitchen remodel in Atlanta with beaded inset cabinets and two islands


Find the right local pro for your project

 Patterson Custom Homes
Beach style dark wood floor family room photo in Orange County with white walls, a standard fireplace, a concrete fireplace and a wall-mounted tv

 Starr Custom Homes
This 3000 SF farmhouse features four bedrooms and three baths over two floors. A first floor study can be used as a fifth bedroom. Open concept plan features beautiful kitchen with breakfast area and great room with fireplace. Butler's pantry leads to separate dining room. Upstairs, large master suite features a recessed ceiling and custom barn door leading to the marble master bath.
 Interior Pros - Design Studio
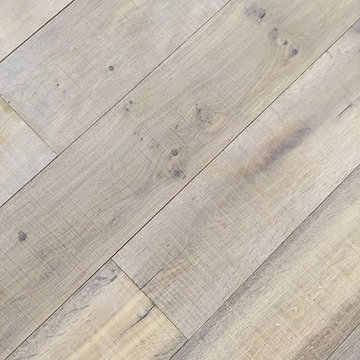
The grey trend has evolved in the last twelve months. Nowadays browns, beige and a touch of grey are in demand. Greige is the new buzzword.
Heavier hand scraped or contoured products, the rage that started around 2005 has taken a back seat in most areas, while a softer wire brushed "ceruse effect" seen mostly on White Oak has been remarkably strong showing no effects of becoming “dated” like the others mentioned.
Ceruse Color Possibilities
There are numerous color combinations to the "cerused" process with the most popular being white or off white. This design trend in hardwood flooring can have darker gray white oak with a mild ceruse off white effect.
There are limitless possibilities in either a prefinished hardwood floor or with what we can create for you in a custom on-site finished hardwood floor.
If something suits your fancy, contact us and we can work on creating just the look and sense of style you are looking for.

 safe ZOnea
If you’re active on GardenWeb sharing plant photos, asking for advice, tracking seasonal progress you already understand how much detail goes into gardening. Soil pH, rainfall, emerging leaves, bloom counts, fertilizer schedules it adds up fast. But all that rich information often remains buried in posts, lists or memory. What if you could visualize that data and turn it into clear quick insights? That’s where a graph maker becomes a game-changer for your gardening workflow.
1. Why garden data belongs on a graph
On GardenWeb, you’ll find forums for everything from perennial care, vegetable gardening, patios, herbs, even cooking and craft projects. While plant lovers share observations and ask questions, many track progress manually in spreadsheets or memory. A graph maker flips that around:
Instead of a list of numbers (e.g., “Soil test: pH 6.4 in May, 6.1 in October”), you get a line graph showing the decline over time.
Instead of guessing which plant bloomed most, you see a bar chart comparing counts across plants.
Instead of manually calculating average rainfall effect, you plot scatter points of bloom count vs. rainfall.
By turning your data into visuals, you’re not just recording—you’re analysing, learning and improving. For GardenWeb users this means smarter decisions: Which fertilizer actually improves bloom count? Which shady spot recovers slower? A graph maker gives clarity.
2. What is a graph maker and how to use one
A graph maker is a web tool or software that lets you input raw data (numbers, dates, categories) and output visual charts like line graphs, bar charts, scatter plots, etc. It might allow you to import a spreadsheet, select chart type, customize colours, label axes, and export the image for your blog, forum post or personal log.
Here’s how you could apply it for gardening:
Log blooms per week for each rose plant.
Using the graph maker, choose line graph to track changes over weeks.
Label your y-axis “Number of Blooms”, x-axis “Week of Year”.
Add colour lines for each plant for easy comparison.
Export as PNG and embed it in a GardenWeb forum post: “See bloom trend for my ‘Peace’ vs ‘Knock Out’ roses”.
This isn’t just pretty-to-look-at: it makes the trend obvious, invites discussion (“Hey, your ‘Knock Out’ line dips after week 28—what changed?”) and helps you refine your routine.
3. Use these specific scenarios on GardenWeb
A. Soil pH and plant health tracking
After multiple tests you have pH values over time and bloom results. Upload both datasets into the graph maker, produce a dual-axis line graph: soil pH on one axis, bloom count on the other. Post your findings in the “Soil, Fertility & Nutrients” forum and get feedback.
B. Seasonal pest or disease appearance
Record number of aphids spotted each month and whether you used treatment. A bar chart via the graph maker can show pre- and post-treatment figures. Then ask the “Insect & Disease Control” forum for advice based on your visual data.
C. Yield comparison between varieties
You grow two zucchini varieties. You keep weekly yield in pounds. Use the graph maker for a side-by-side bar chart. Share in the “Vegetable Gardening” forum: “Which was better this year? See the chart”.
D. Rainfall vs growth rate
You log weekly rainfall and growth (in cm) of your tomato plants. Use scatter plot in graph maker. If a pattern emerges, you’re ready to post: “Is my growth plateau due to drought? Chart shows a clear correlation.”
4. Why this elevates your GardenWeb contributions
When you post with a chart made by a graph maker, you’re doing more than asking or showing off. You’re investigating. You’re analysing. You invite the community to give feedback on data, not just anecdotes. That elevates the discussion. Instead of “My plant died, any ideas?” you post “See this graph of pH drop and bloom count—what might be the limiting factor?” High-quality visuals raise your post’s value and garner more thoughtful responses.
Plus, your posts become useful references for others: someone else can say, “Cool graphic, can you share your data sheet?” You build credibility and help the forum become a learning hub—not just a Q&A board.
5. Tips for using a graph maker effectively in the GardenWeb context
Keep it simple: One chart, one insight. Don’t overcrowd.
Label clearly: Titles, axis labels, units (e.g., cm/week, mg/L, °F).
Use readable colours: Avoid faint tones that vanish on mobile.
Annotate when needed: Add notes like “Fertiliser switched week 12” or “Shade cloth added”.
Provide context in your post: Don’t leave the chart alone—write a few sentences explaining what it shows and what you’re seeking.
Embed carefully: Make sure your image displays properly in GardenWeb; check mobile view.
Share raw data: If possible link to your spreadsheet so others can replicate or comment.
Be open to feedback: The chart invites questions; embrace them.
6. Possible pitfalls and how to avoid them
Bad data = bad chart: If your measurements aren’t consistent, your graph will mislead. Use standardized data collection.
Too much complexity: Multi-axis charts, too many variables—confusing. Stick to one or two variables.
Overlooking mobile viewers: Many GardenWeb users browse via phones. Use large fonts and simple visuals.
Ignoring the narrative: Chart alone won’t answer. Explain what it means and what you need.
Outdated charts: If you update your data annually, keep your visuals current or label them clearly as “2024 data”.
7. Final thoughts
On GardenWeb you’ll find a vibrant community of gardeners, DIYers, cooks and design lovers.Using a graph maker for your posts and progress turns your experience from casual hobby-logging into smart data-driven gardening. You’ll not only learn more—your peers will learn more, too.
So next time you log your plant growth, record your yield, test your soil or track pests—don’t just note it. Plot it. Use a graph maker. Share it in the forum. Let your garden tell the story, and let the community help you write the next chapter.


 Cypress Design Co.
Example of a large classic l-shaped ceramic tile eat-in kitchen design in Providence with an island, raised-panel cabinets, medium tone wood cabinets, granite countertops, beige backsplash, ceramic backsplash, stainless steel appliances, an undermount sink and green walls

 HAUS | Architecture For Modern Lifestyles
Living space with curved clear cedar ceilings, built-in media and storage walls, custom artwork and custom furniture - Interior Architecture: HAUS | Architecture + LEVEL Interiors - Photography: Ryan Kurtz

 MEC
PEACOCK FANTASY - Custom Designed Peacock Wall Mural in brilliant colors. Notice how it has just the right amount of color | Have a custom mosaic idea? We can help, with our brilliant Italian-trained mosaicists and easy-to-install tiled masterpieces. Worldwide shipping available on the complete range of quality handcrafted marble & glass mosaic products. For inquires and more info, contact us: http://mecartworks.com

 Elegant Hardwood Floors
maple hardwood floor, water-popped, and stained with 50% rosewood and 50% neutral stains.
Inspiration for a timeless medium tone wood floor living room remodel in Salt Lake City
Inspiration for a timeless medium tone wood floor living room remodel in Salt Lake City


 Kitchen & Bath Gallery
The shower floor is a basket weave marble-look porcelain mosaic.
Photography by Kyle J Caldwell
Example of a transitional white tile and mosaic tile marble floor bathroom design in Providence
Example of a transitional white tile and mosaic tile marble floor bathroom design in Providence
 HAUS | Architecture For Modern Lifestyles
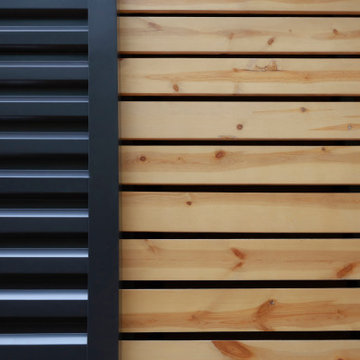
Exterior siding deails contrasts metal and wood - Bridge House - Fenneville, Michigan - Lake Michigan - HAUS | Architecture For Modern Lifestyles, Christopher Short, Indianapolis Architect, Tom Rigney, TR Builders

 Regenesis Ecological Design
This interlocking concrete permeable paver driveway is set in an ashlar pattern to create a decorative but versatile look. This driveway allows stormwater to infiltrate into the ground - instead of running off the landscape into streams and rivers where is can cause flooding and pollution.

 Shuler Architecture
This 3 BR, 3 1/2 bath home allows the owners to live on one level most of the time. The Master Suite is on the main level along with the Living Room, Kitchen, Dining, pantries, Sun Room and service areas. The upper level houses two ample bedrooms while the lower level supports a rec center, media room, wine cellar, shop and full wet bar. Conceived as a Great Room house, the main level is designed as one seamless space that flows onto an ample deck overlooking the rear yard.
We also incorporated a variety of green building techniques - photo-voltaic shingles on the roof of the garage to generate a portion of the home's energy, a super insulated building envelope, rain water harvesting, high performance windows and doors, a high efficiency heat pump, low flow bath & kitchen fixtures, Energy Star appliances and LED lighting - that greatly reduced this structure's carbon footprint. All of the strategies amounted to a 30% reduction in the energy consumption in this home relative to comparable structures.

 L & L Home Restoration, LLC
Complete luxury with this large walk-in shower. Overhead rainfall panel and two separate shower heads keep you warm and relaxed. The tile is a rustic barnwood look with small travertine squares for the inset.

 Design 1 Kitchen & Bath
Example of a mid-sized classic 3/4 gray tile and stone tile marble floor alcove shower design in Boston with shaker cabinets, white cabinets, a one-piece toilet, blue walls, a pedestal sink and quartzite countertops

 AcousticSmart Home Theatre Interiors
Example of a large minimalist enclosed carpeted and gray floor home theater design in New York with gray walls and a projector screen
3